
Figure 5.
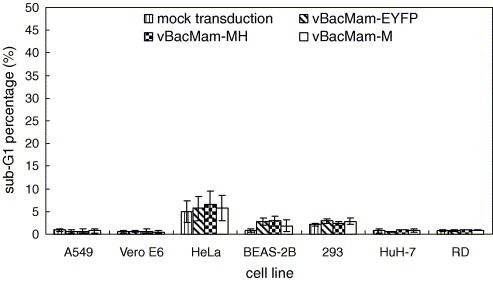
Determination of sub‐G1 phase percentage in mammalian cells that were mock‐transduced or transduced with vBacMam‐EYFP, vBacMam‐MH and vBacMam‐M at MOI 10. The data represent the means ± S.D. of three independent experiments.
Official websites use .gov
A
.gov website belongs to an official
government organization in the United States.
Secure .gov websites use HTTPS
A lock (
) or https:// means you've safely
connected to the .gov website. Share sensitive
information only on official, secure websites.
Determination of sub‐G1 phase percentage in mammalian cells that were mock‐transduced or transduced with vBacMam‐EYFP, vBacMam‐MH and vBacMam‐M at MOI 10. The data represent the means ± S.D. of three independent experiments.