
Figure 2.
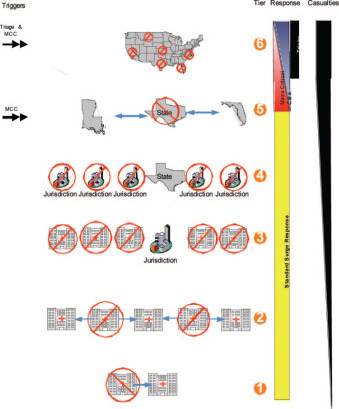
Critical care response to an expected or slowly evolving mass casualty event. The figure above provides an integrated overview of the reactive response to an expected event producing critically ill or injured individuals. Examples of an expected or slowly evolving event include an influenza pandemic or widespread radiation exposure. In such an event, there is adequate lead time to allow the system to take actions to prepare for the impending surge of critically ill patients. Working from left to right in the diagram. Trigger thresholds: These represent points when criteria are met for activation of various tools such as mass critical care and triage. Tiers: This graphic component of the diagram describes the tiers of the response (moving upwards). Based on the magnitude of the event, higher tiers will be activated. Graphical figures illustrate hospitals, jurisdictions (ie, a city), states, and a nation. The circle and slash denotes that the associated resource is overwhelmed. From bottom up: Row 1: Individual facility response occurs either early in an event as the first receiving hospitals are impacted or in events with smaller magnitudes. Row 2: Health-care coalition response occurs when several local area hospitals are overwhelmed. Row 3: Local jurisdictional response occurs when the resources of an entire jurisdiction are drawn on due to direct impact or via mutual aid responses. Row 4: State responses are activated to support events occurring in multiple jurisdictions or if the entire state is impacted. Row 5. Interstate regional responses draw on the resources of neighboring states as entire states are overwhelmed. Row 6: Federal responses are required for large events usually involving a wide geographic area. Response: Given the advanced preparations it is anticipated that standard surge strategies will be employed as tiers 1 to 4 are impacted. Mass critical care strategies should only be employed if resources at or beyond tier 5 will be overwhelmed and critical care triage protocols should only be used when resources beyond tier 5 will be overwhelmed. Casualties: This is an illustrative graphic of critically ill casualties generated by an event. The impact of an event is not solely dependant on the absolute number of casualties but also the specific medical needs of the casualties and the available resources. See Figure 1 legend for expansion of abbreviation.