
Fig. 3.
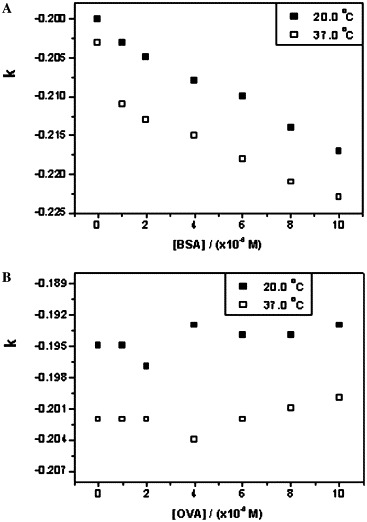
Plots of k versus the concentrations of BSA and OVA. (A) Interaction between octapeptide and BSA at 20 and 37 °C. (B) Interaction between octapeptide and OVA at 20 and 37 °C.
Official websites use .gov
A
.gov website belongs to an official
government organization in the United States.
Secure .gov websites use HTTPS
A lock (
) or https:// means you've safely
connected to the .gov website. Share sensitive
information only on official, secure websites.
Plots of k versus the concentrations of BSA and OVA. (A) Interaction between octapeptide and BSA at 20 and 37 °C. (B) Interaction between octapeptide and OVA at 20 and 37 °C.