
Figure 3.
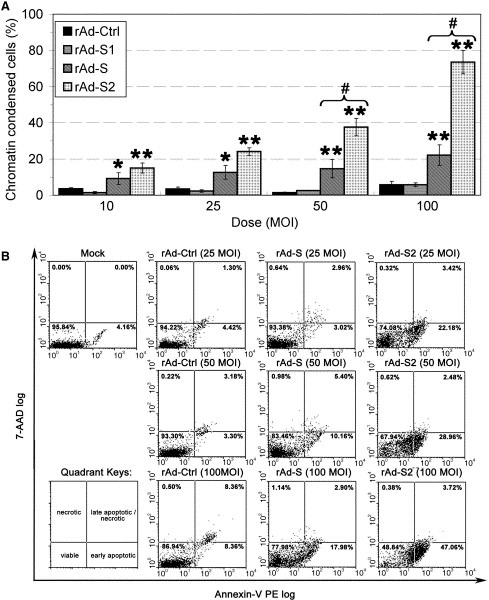
Transduction of rAd‐S2 showed a stronger apoptotic effect than that of rAd‐S in Vero E6 cells. (A) Dosage‐dependence of the apoptotic effect induced by rAd‐S and ‐S2 in terms of chromatin condensation. Cells were transduced by rAds at indicated MOIs. The percentage of apoptotic cells was determined by Hoechst 33342 staining at 84 h p.t as in Fig. 1B. (B) Early apoptosis of Vero E6 cells transduced by rAd‐S and ‐S2. The asymmetry of the plasma membrane of rAd‐S and ‐S2 transduced cells at 84 h p.t. was monitored by double staining with the Annexin V and 7‐AAD detected via flow cytometry. Quadrant keys are showed at the lower‐left corner. The percentage of cells in each quadrant is showed at the top of each dot‐plot. Results shown in (B) are representative of three independent experiments.