
Figure 3.
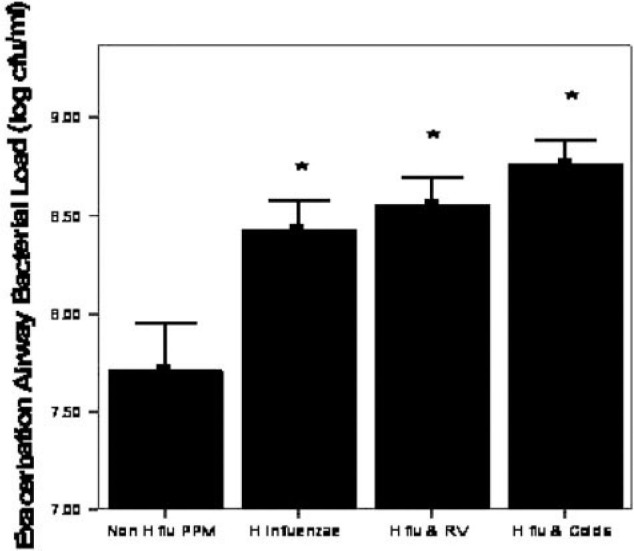
Airway bacterial load at exacerbation for different categories of isolated pathogen(n = 56). Columns represent mean values, with error bars as SEM. RV = rhinovirus; H flu = H influenzae. *Significantly different from all PPM categories.
Official websites use .gov
A
.gov website belongs to an official
government organization in the United States.
Secure .gov websites use HTTPS
A lock (
) or https:// means you've safely
connected to the .gov website. Share sensitive
information only on official, secure websites.
Airway bacterial load at exacerbation for different categories of isolated pathogen(n = 56). Columns represent mean values, with error bars as SEM. RV = rhinovirus; H flu = H influenzae. *Significantly different from all PPM categories.