
Figure 3.
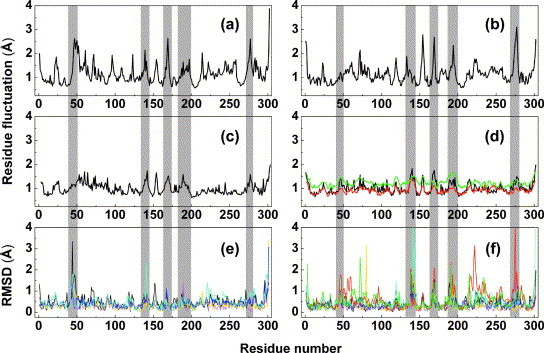
Residue fluctuations for the SARS-CoV Mpro. (a) and (b) Atomic fluctuations of (a) chain A and (b) chain B over the 10 ns equilibrium simulation at pH 6.0. (c) and (d) Mean atomic deviations (〈r〉 values) computed from the experimentally derived B factors using the equation , for (c) chain A and (d) chain B in the SARS-CoV Mpro monoclinic crystal structure (1UJ1.pdb); the corresponding values derived from the new crystal structures are shown in (d) for the tetragonal form (red) and the orthorhombic form (green). (e) and (f) RMSD for (e) monomer A and (f) monomer B for five independent monoclinic crystal structures of SARS-CoV Mpro at pH 6.0, fitted to 1UJ1.pdb, and colored black, yellow, cyan, blue and magenta, respectively. The values for the new crystal structures are shown in (f) for the tetragonal form (red) and the orthorhombic form (green).