
Figure 4.
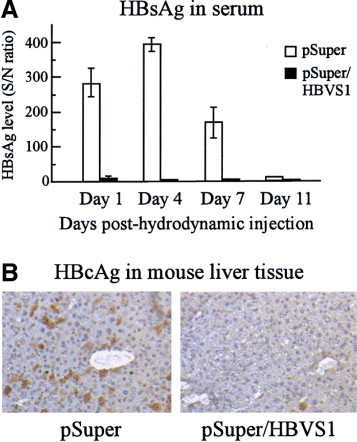
pSuper/HBVS1 suppressed HBV expression in mice. pHBV48 were hydrodynamically injected with pSuper or pSuper/HBVS1 to C57BL/6 mice. There were 3 mice in each treatment group. (A) HBsAg levels in sera of mice treated. The level of HBsAg was expressed as signal to noise ratio (S/N). The data represent the mean values ± SD of 3 mice in each treated group. (B) Immunohistochemical staining for HBcAg in liver sections embedded in OCT. Representative sections are shown. Left panel: liver section from a pSuper-treated mouse. Right panel: liver section from a pSuper/HBVS1-treated mouse.