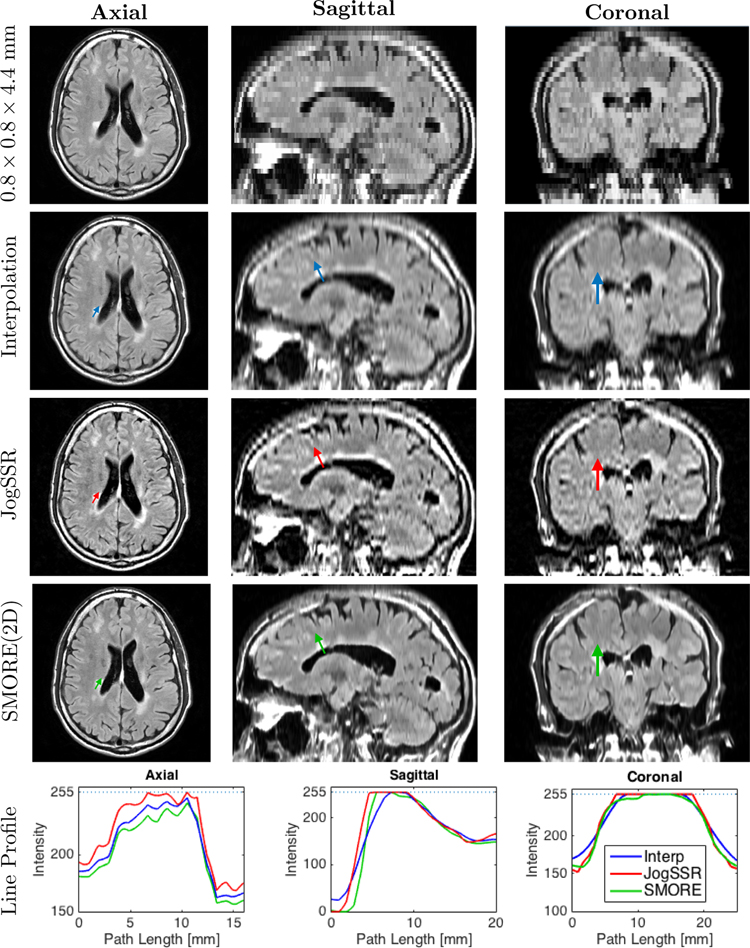
Figure 2: T2 Flair MRI from an MS subject:
Axial, sagittal, and coronal views of the acquired 0.828 × 0.828 × 4.4 mm image, and the reconstructed volumes with 0.828 × 0.828 × 0.828 mm digital grid through cubic b-spline interpolation, JogSSR, and SMORE(2D). In each view, we pick a path across lesions, shown as colored arrows in the images, and plot the line profiles of the three methods in the same plot on the bottom of each view.

