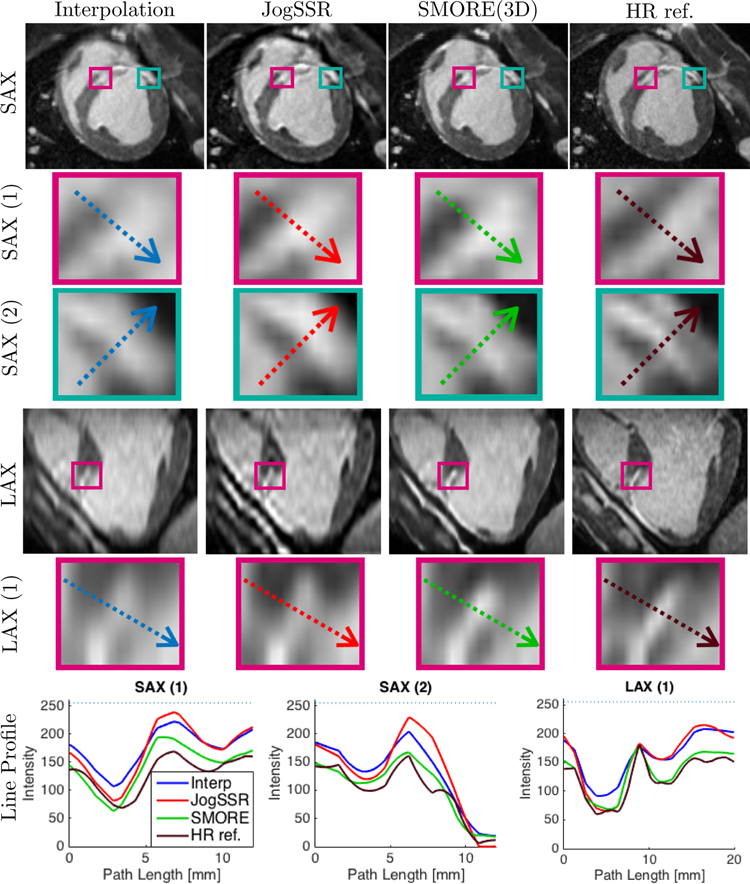
Figure 3: Late gadolinium enhancement (LGE) from an infarct swine subject:
Short-axis (SAX) and long-axis (LAX) views arranged in columns using 1.1 × 1.1 × 1.1 mm digital grid: output of 1) sinc-interpolation, 2) JogSSR and 3) SMORE(3D) for the subject LR image acquired at 1.1 × 1.1 × 5 mm; 4) sinc-interpolated HR reference image for comparison acquired at 1.1 × 1.1 × 2.2 mm. SAX(1) and LAX(1) boxes contain a thinning layer of enhanced midwall scar between endo- and epi layers of normal myocardium (hypo-intense). SAX(2) boxes contain a thin layer of normal myocardium (hypo-intense) between scar and epicardial fat (both hyper-intense). In each box, we pick a path across the region of interest, shown as colored arrows, and plot the profiles in the last row.

