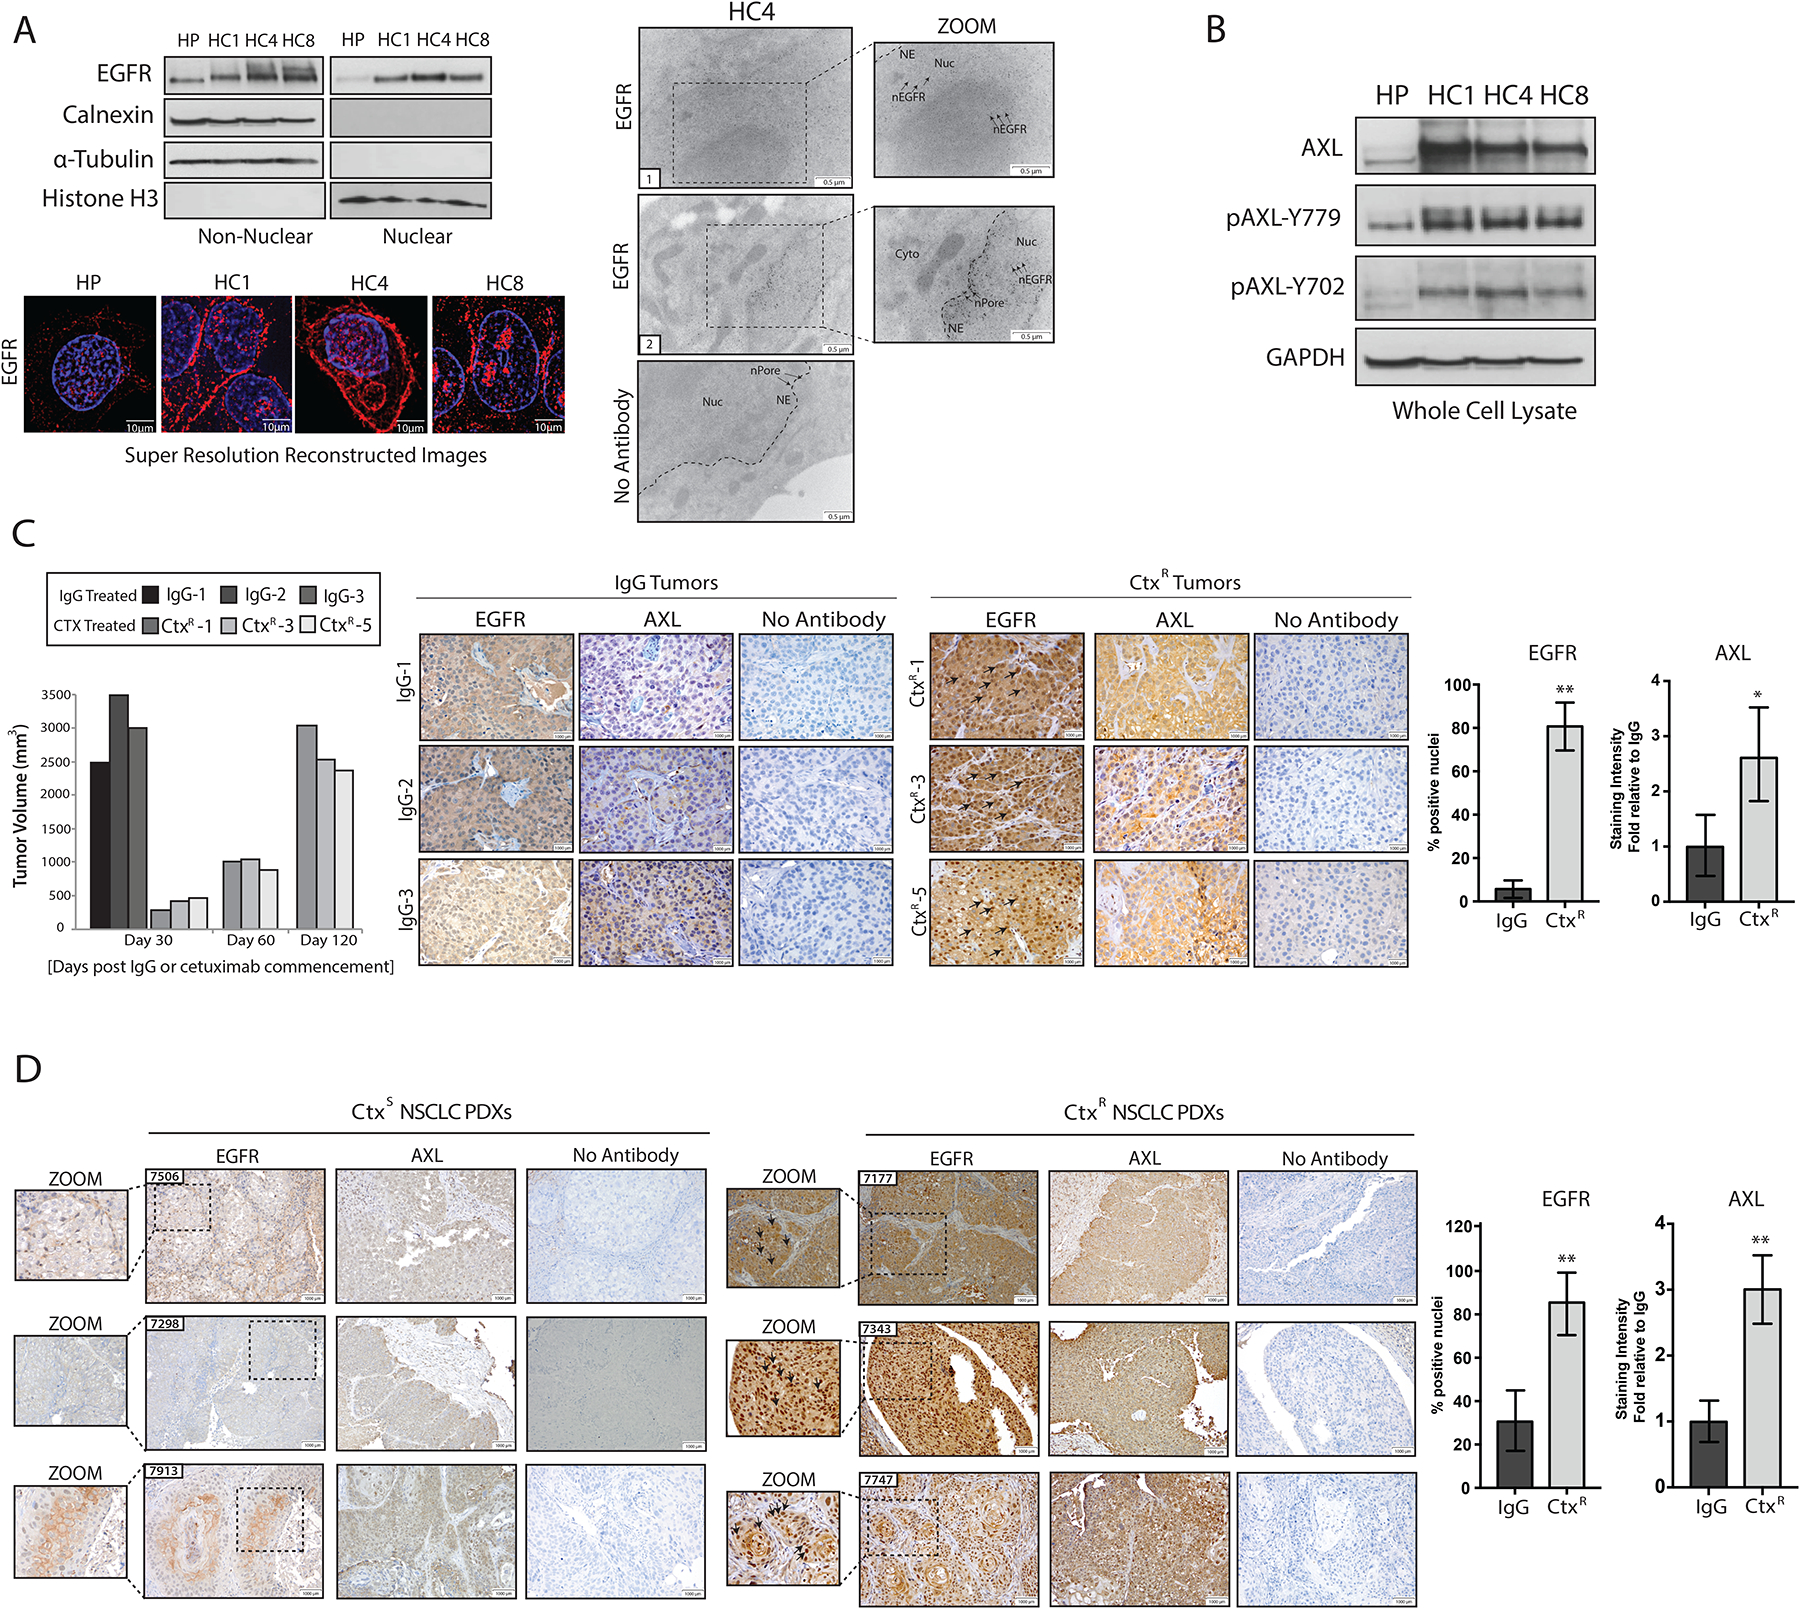
Figure 1: CtxR clones and xenografts have increased abundance of nEGFR and AXL.

(A) Immunoblotting (top, left) in non-nuclear and nuclear lysates harvested from three CtxR clones (HC1, HC4, and HC8) and the CtxS parental cell line HP. Calnexin, α-Tubulin, and histone H3 were used as loading and purity controls for non-nuclear and nuclear lysates, respectively. Structured resolution microscopy (bottom) in parental (HP) and CtxR clones stained for DAPI (blue) and EGFR (red) (bottom). Magnification, 100X. Scale bars, 10μm. Transmission electron microscopy (TEM; right) of fixed HC4 cells labeled with EGFR antibody-bound gold particles. Black arrows in insets mark gold particles in the nucleus. Cyto, cytoplasm; NE, nuclear envelope; nPore, nuclear pore; Nuc, nucleus. Scale bars, 0.5 μm. (B) Immunobloting in whole cell lysates from HP and CtxR clones. GAPDH: loading control. (C) Tumor volume (left) and immunohistochemical staining for EGFR and AXL in representative NCI-H226 xenografts (right) from IgG- or cetuximab-treated mice (n=4 and 5 mice, respectively; representative sections from 3 of each group are shown). Magnification, 40X. Scale bars, 1000 μm. (D) Immunohistochemical staining for EGFR and AXL abundance in CtxS and CtxR NSCLC PDXs. Magnification, 20X. Scale bars, 1000 μm. Black arrows in insets mark nEGFR. nEGFR and AXL abundance were quantified with ImageJ software. AXL staining intensity in CtxR tumors was normalized to that of the IgG or CtxS tumors (n=6 mice; representative sections from 3 of each group are shown). Data are means ± SD of 3 independent fields of view per tumor. * P < 0.05; ** P < 0.01, by two-tailed Student t-test. Blots and microscopy are representative of 3 experiments.
