
Figure 2: EGFR nuclear translocation is dependent on AXL.
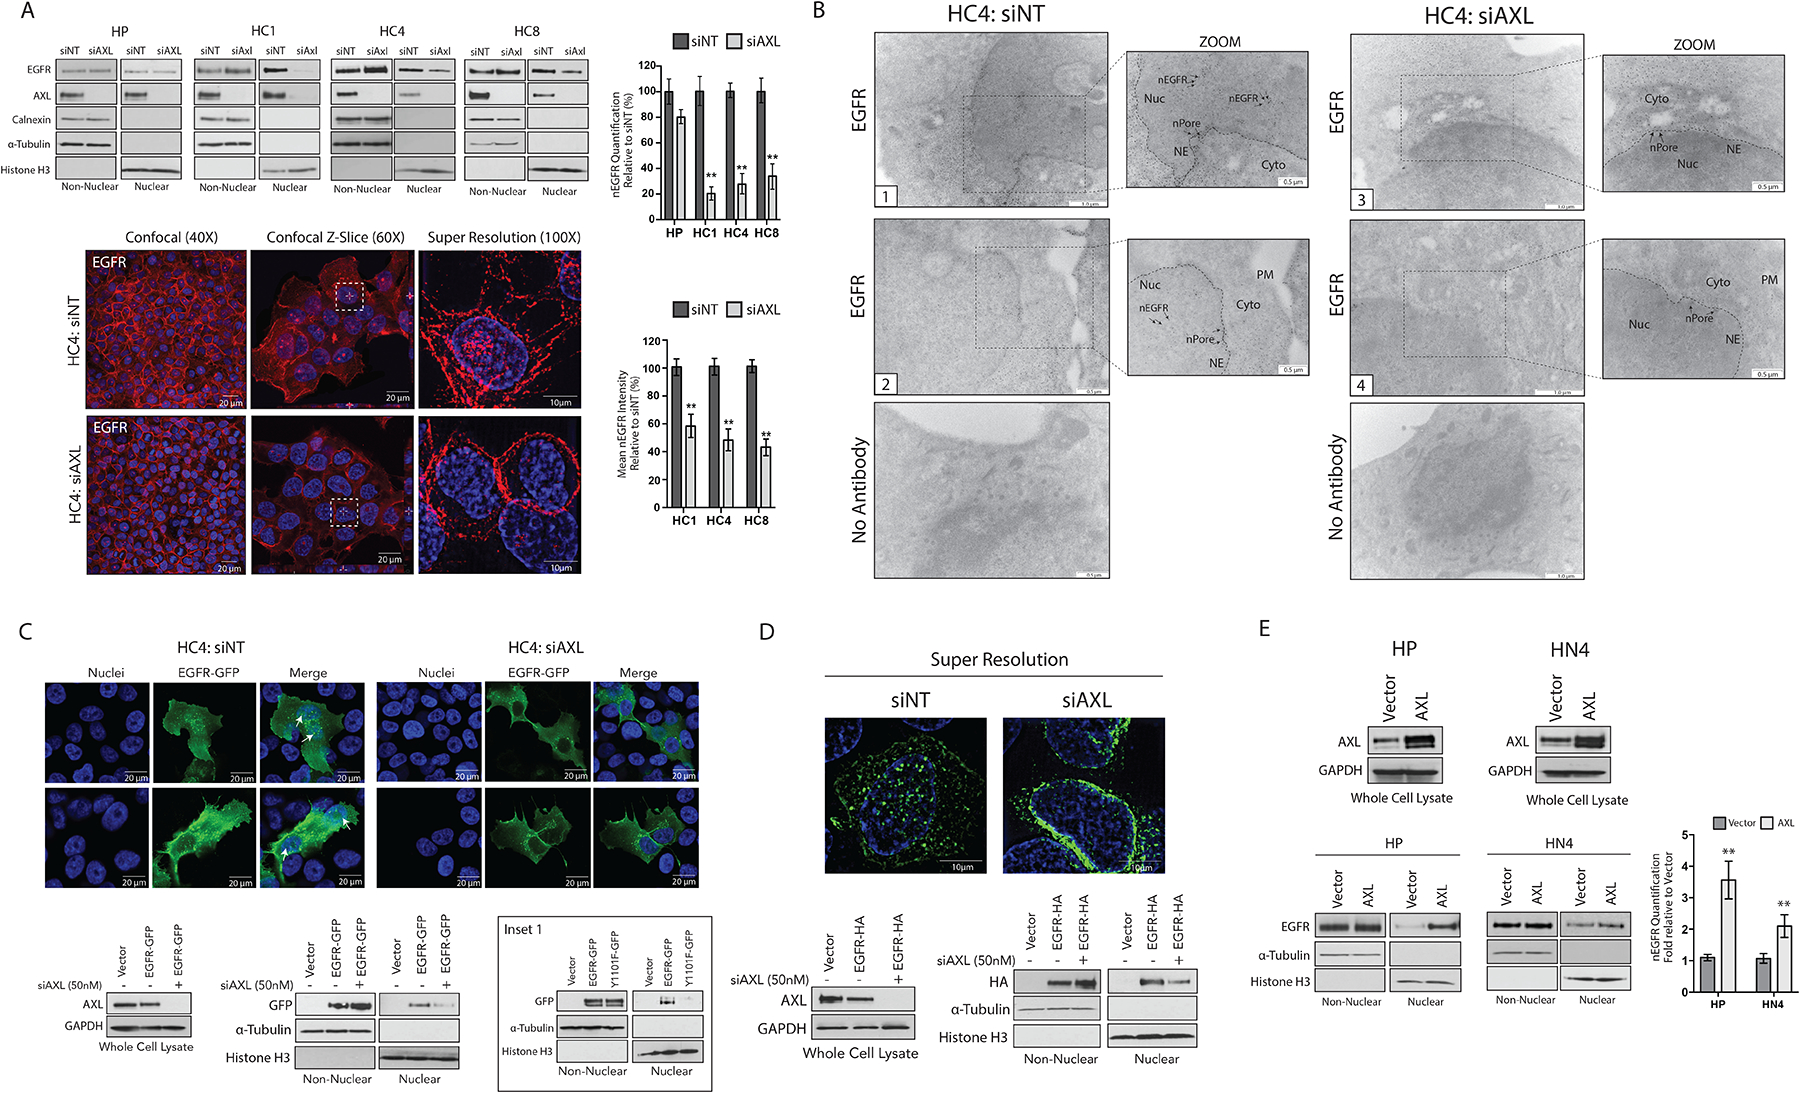
(A) Non-nuclear and nuclear proteins were harvested from HP and CtxR clones 72 hours after transfection with siAXL or siNT followed by immunoblotting for the indicated proteins. Confocal and super resolution microscopy was performed in HC4 cells 72 hours after transfection with siAXL or siNT. Confocal imaging depicts overlap between DAPI (blue) and EGFR (red). Magnification, 40X. Scale bars, 20 μm. Z-slice imaging depicts this overlap (white dashed-line boxes). Magnification, 60X. Scale bars, 20 μm. Super resolution imaging depicts overlap of DAPI (blue) and EGFR (red). Magnification, 100X. Scale bars, 10 μm. (B) TEM of fixed HC4 cells transfected with siAXL or siNT for 72 hours and subsequently labeled with EGFR antibody-bound gold particles. Black arrows in insets mark gold particles in the nucleus; n= 100 cells analyzed per condition from three independent experiments. Cyto, cytoplasm; NE, nuclear envelope; nPore, nuclear pore; Nuc, nucleus. Scale bars, 0.5 μm (zoom view) or 1.0 μm. (C and D) HC4 cells were transfected with siAXL or siNT for 24 hours prior to overexpression of EGFR-GFP (C) or EGFR-HA (D) for an additional 48 hours. Whole cell, non-nuclear and nuclear lysate was harvested followed by immunoblotting for the indicated proteins. Confocal IF was performed to visualize GFP localization in the nucleus (white arrow). Magnification, 60X. Scale bars, 20 μm. Super resolution microscopy was used to visualize HA localization in the nucleus. Magnification, 100X. Scale bars, 10μm. Inset 1 (C), imunoblotting of non-nuclear and nuclear proteins from HC4 cells 48 hours after transfection with vector, EGFR-WT-GFP or EGFR-Y1101F-GFP. (E) Whole cell, non-nuclear and nuclear proteins were harvested from HP and HN4 cells stably overexpressing pcDNA6.0-AXL or pcDNA6.0-Vector control followed by immunoblotting for the indicated proteins. For presented immunoblots, GAPDH, α-Tubulin, calnexin, and histone-H3 were used as loading and purity controls for whole cell, non-nuclear, and nuclear lysates, respectively. Microscopy and blots are representative of 3 experiments and ImageJ software was used to quantify nEGFR abundance. Data in (A) and (E) are mean ± SD of three independent experiments. ** P < 0.01, by two-tailed Student t-test.