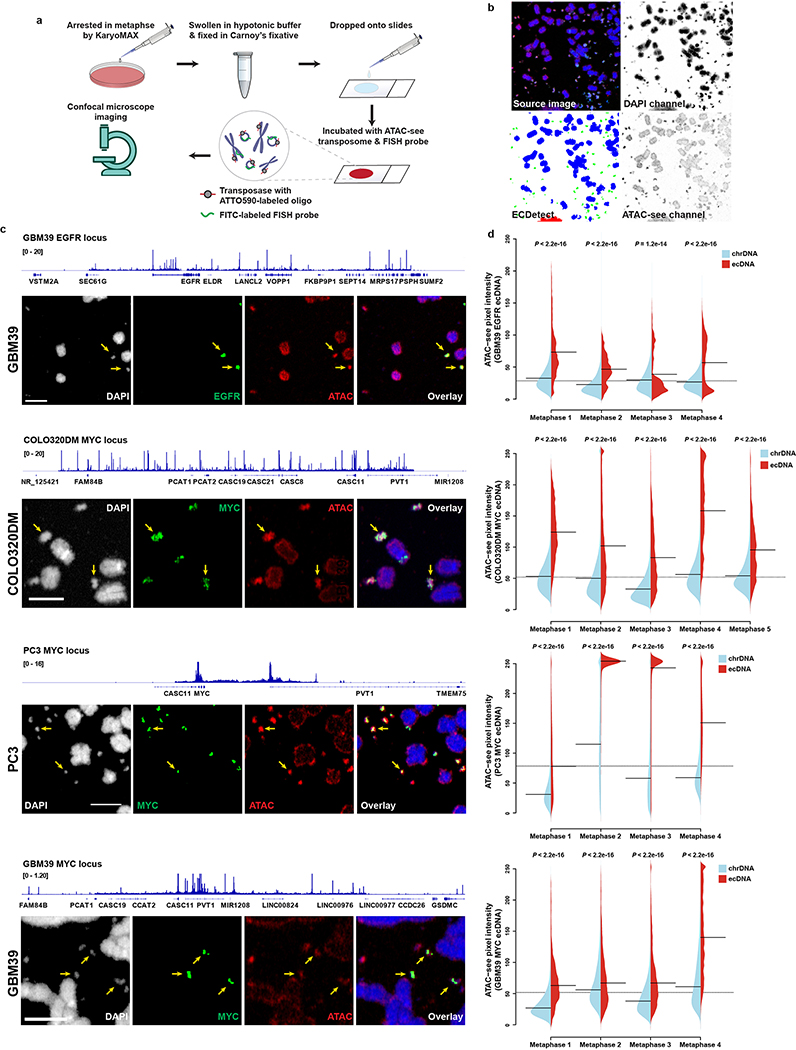
Extended Data Figure 7 |. ATAC-see visualization of ecDNA accessibility in metaphase chromatin.
a, The strategy of applying ATAC-see to DNA in cells in metaphase.
b, Image analysis pipeline, showing ecDNA and chrDNA segmentation of the DAPI channel. The pixel intensity of ATAC-see channel was measured.
c, ATAC-seq tracks and corresponding representative images of FISH and ATAC-see (scale bar: 5 μm).
d, Quantification of ATAC-see pixel intensity of ecDNA vs. chrDNA from at least 4 independent metaphase spreads. Violin plots show the overall distribution of data points. The dashed line across the plot indicates the global mean value. The solid black lines inside each split violin plot indicate the mean of each data set (Two-sided Z test).

