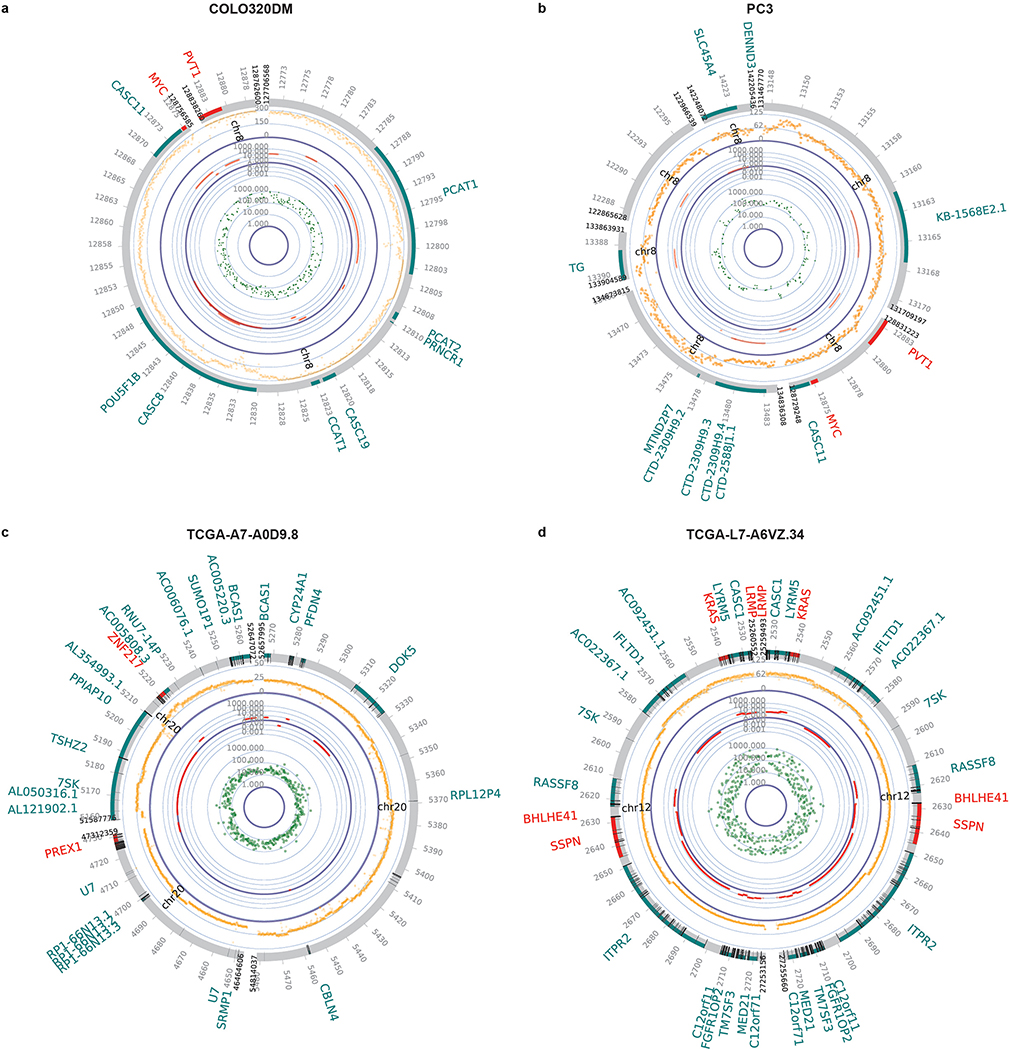
Extended Data Figure 8 |. Circular plots for ecDNA.
a-d, Composite circular plots displaying WGS, RNA-seq and ATAC-seq of ecDNA. For COLO320DM and PC3 cells with multiple versions of reconstructed structures, only one representative structure was shown. For TCGA samples (c, TCGA-A7-A0D9, breast invasive carcinoma; d, TCGA-L7-A6VZ, esophageal carcinoma), the ATAC-seq data point represents the highest signal within a 1 kb window.

