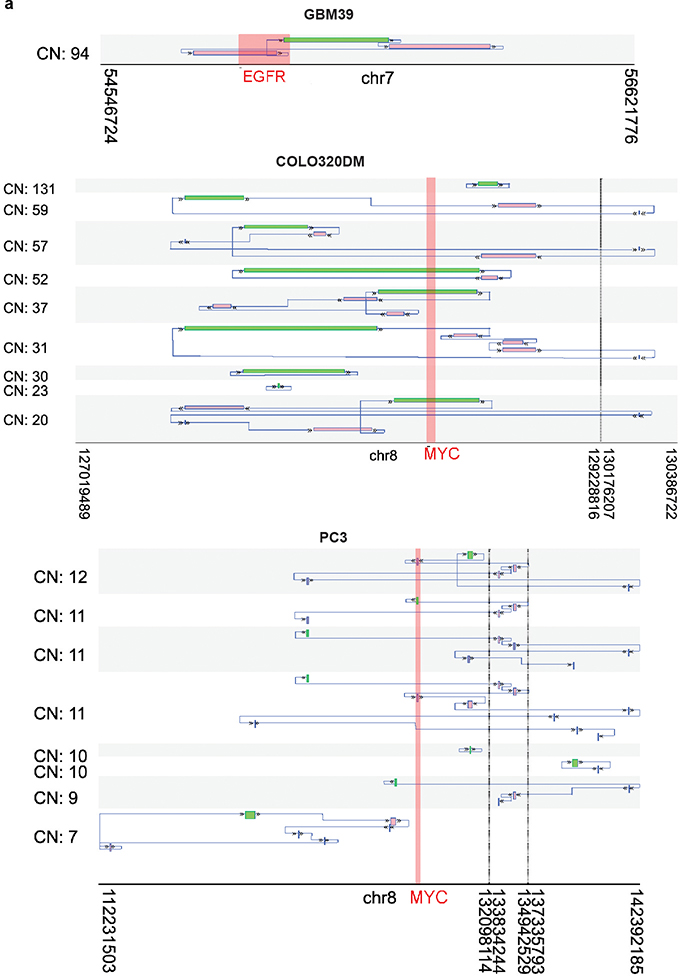
Extended Data Figure 9 |. Reconstructed ecDNA structures.
a, Examples of selected potential amplicons reconstructed from AmpliconArchitect in GBM39, COLO320DM, and PC3 cells. For each potential amplicon, the average copy number (CN) of the segments is listed. The starting segment of the structure is outlined in green. From the starting segment, the structure can be traced by following the arrows to find the next genomic segment of the structure. Some structures have a circular path (i.e., can return to the starting segment by following the arrows) which represents potential ecDNA structure.

