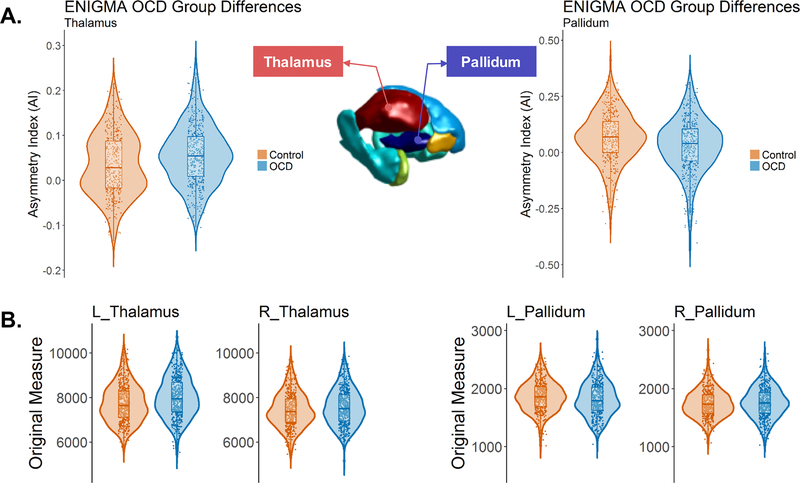
Figure 2. Subcortical structures showing altered volumetric asymmetry in pediatric OCD patients: the thalamus and the pallidum.
The violin plots show the distributions and group differences of the volume asymmetry (A) and the lateral volume measures (in mm3) in each hemisphere (B) for the thalamus and the pallidum. Note that the main analyses were based on linear mixed-effect modelling with ‘dataset’ as a random-effect term, whereas data are plotted here without correction for the ‘dataset’ variable, for display purposes only.

