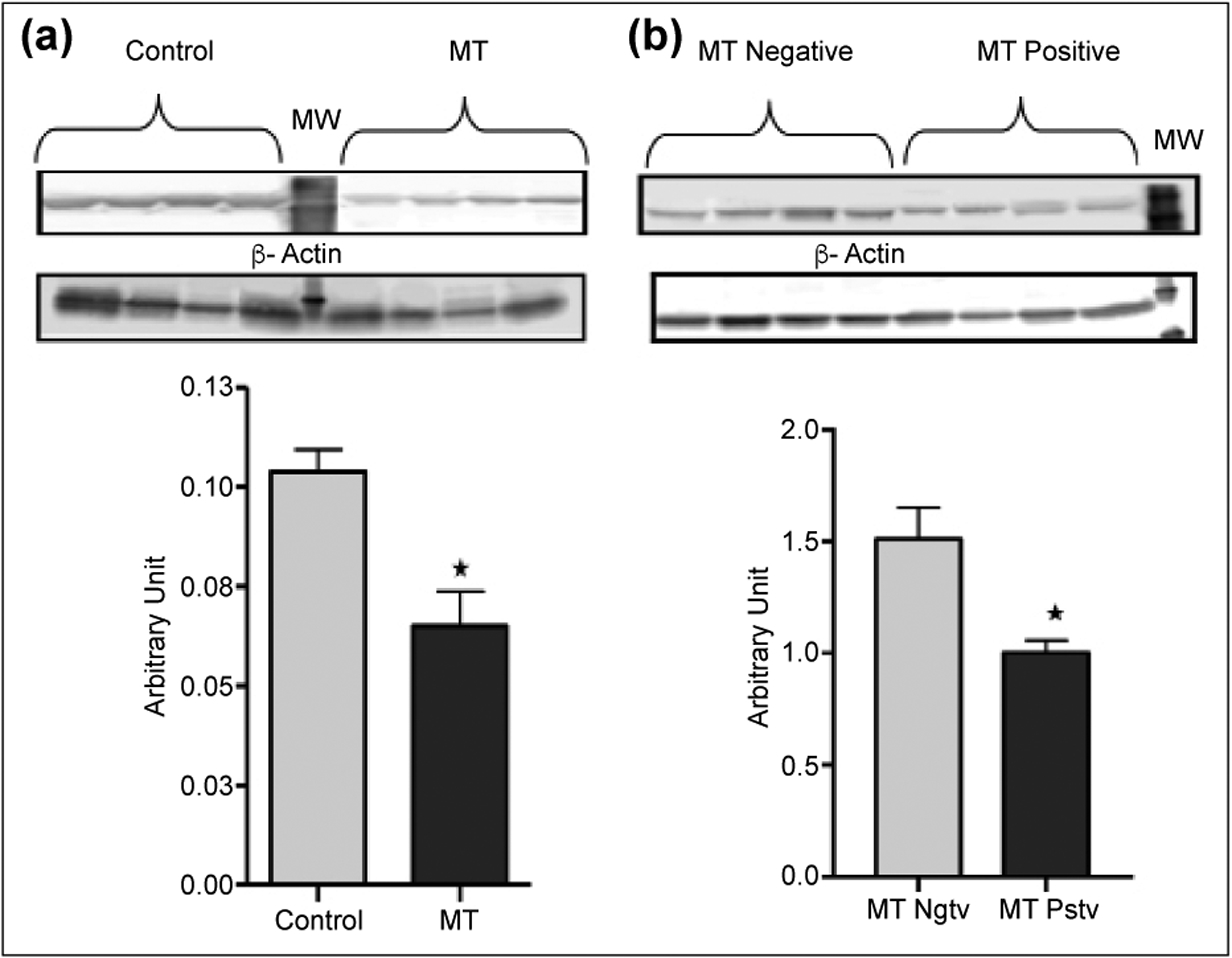
Figure 1.

Protein expression levels of AdipoR1 in animals with and without MT after 74 weeks of age. AdipoR1 protein expression levels in MT or control tissues (Panel A) and in MFP tissues (Panel B) were measured using western blot analysis as explained in the materials and methods section. Control tissues were removed from the same location where MT grows in MT-positive animals at the same age. Data shown here are the average density values of eight individual mice in each group (n=8). MFP and either MT or control tissues were taken from the same animal for each “n” values. *Indicates statistically significant difference (p=0.0022 for panel A, and p=0.0073 for panel B). MW stands for molecular weight marker. MT: Mammary tumor; MW: Molecular weights.
