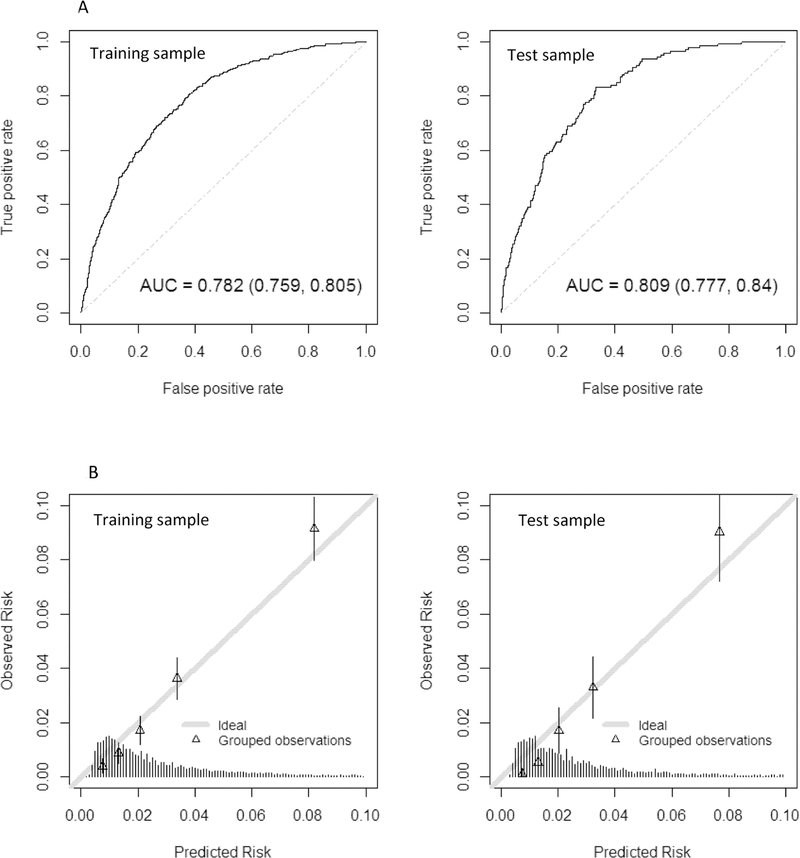
Figure 2.
The performance characteristics of the final restricted eRADAR model are shown for the training sample (left panels) and test sample (right panels). Figure 2a shows the receiver operating characteristic (ROC) curves with c-statistics. The ROC curve plots the sensitivity (true positive rate) against 1 - specificity (false positive rate) for consecutive cutoffs for the probability of unrecognized dementia. The c-statistic reflects the area under the ROC curve (AUC), with values of 0.5 reflecting prediction no better than chance and 1 reflecting perfect prediction.
Figure 2b provides a graphical assessment of calibration (i.e., the extent to which predicted risk matches actual risk). The mean predicted probability of unrecognized dementia is plotted against the observed proportion of unrecognized dementia cases by quintiles of predicted risk. The figure shows close alignment between observed and predicted values (ideal calibration aligns with the 45-degree line). The histogram at the bottom shows the distribution of the predicted risks. Most visits had relatively low predicted risk of undiagnosed dementia (<5%). Supplementary Figure S1 provides similar figures for the model that considered the full set of predictors.

