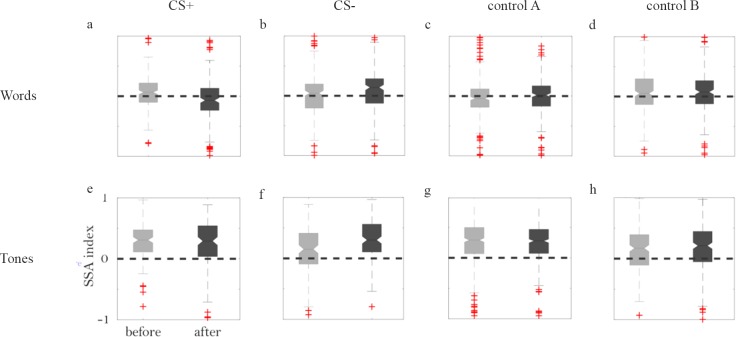
Fig 4. Changes in SSA following conditioning.
(a) Box plots showing the distribution of SSA indices before (left, gray) and after (right, black) conditioning, for word-like stimuli used as CS+. The dashed line is at 0, corresponding to equal responses to standards and to deviants. The box is centered on the median of the distribution and its top and bottom edges indicate the 25th and 75th percentiles of the distribution. Outliers are marked by red plus signs, and the whiskers show the extent of all the data that is not considered as outliers. The notches represent 5% confidence intervals around the medians. The data on which the boxplots are based include 214 SSA values determined from responses before conditioning and 186 SSA values determined after conditioning, from 10 rats conditioned to word-like stimuli. (b) The same for word-like CS- stimuli (205 values before and 199 after conditioning, 10 rats). (c) The same for the responses to word-like stimuli recorded in animals conditioned with tones (265 values before, 255 after, 6 rats). (d) The same for responses to word-like stimuli recorded in pseudo-conditioned animals (218 values before, 214 after, 5 rats). (e)-(h) The same, for tone stimuli. In this case, control A (panel (g)) consisted of recordings of tone responses in the 10 animals conditioned with word-like stimuli. Number of SSA values (before conditioning, after conditioning, number of rats): (e) (132,132,6); (f) (134, 144, 6); (g) (382, 403, 10); (h) (205, 212, 5). The axes labels and tick labels of panel (e) are common to all panels in this figure.

