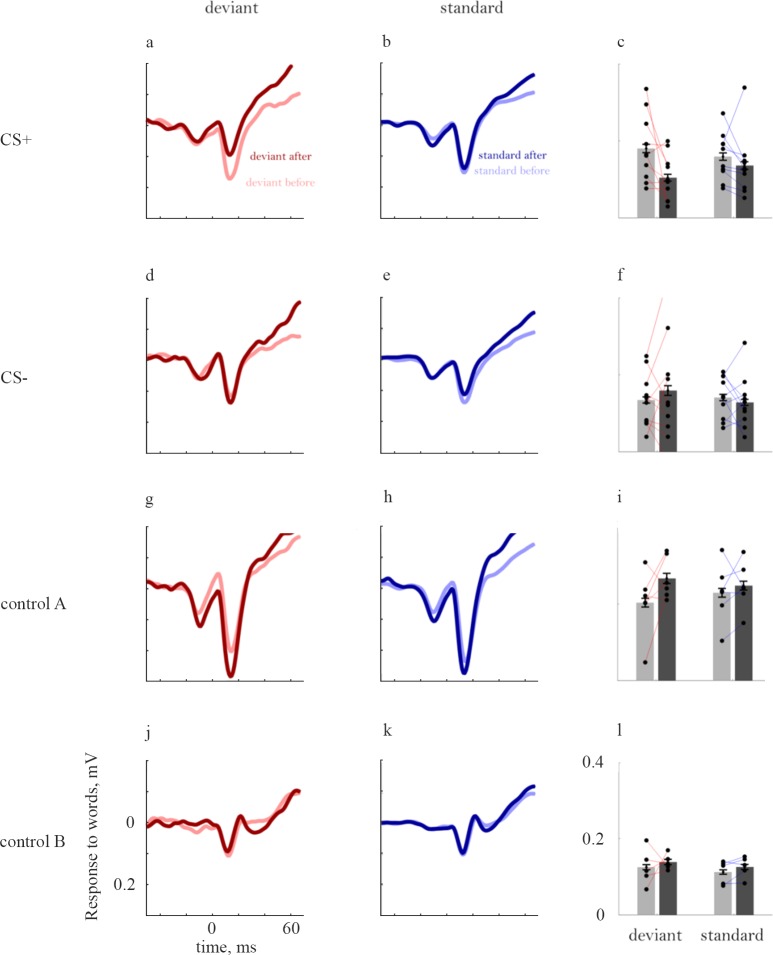
Fig 5. Changes in the responses to word-like stimuli following conditioning.
(a) Responses to CS+ word-like stimuli when deviants. The light red line shows the grand mean response when these stimuli were tested as deviants before conditioning. During conditioning, the same word-like stimuli were used as CS+. The dark red line shows the responses to the same stimuli when tested again as deviants after conditioning. time 0 is the onset of the first vowel (2nd red line in Fig 3). (b) The same, for the responses to the CS+ word-like stimuli when tested as standards. (c) Average peak responses to the same stimuli. The bars represent the average peak response before (gray) and after (black) conditioning. The dots represent the average peak response across all electrodes and sessions in each animal. The peak responses before and after conditioning in each individual animal are connected with a line. (d-f) The same, for word-like CS- stimuli. (g-i) The same, for the responses to word-like stimuli tested in rats conditioned with pure tones (Control A). (j-l) The same, for the responses to word-like stimuli tested in pseudo-conditioned rats (Control B). Note that in this case, while the average response (panel j) was slightly smaller after than before conditioning, the average peak response (panel l) was slightly larger. The reason for such discrepancies here and elsewhere is the fact that peak responses were determined in each electrode and animal individually, and therefore could occur at time points that are different than the time point of the average peak response.

