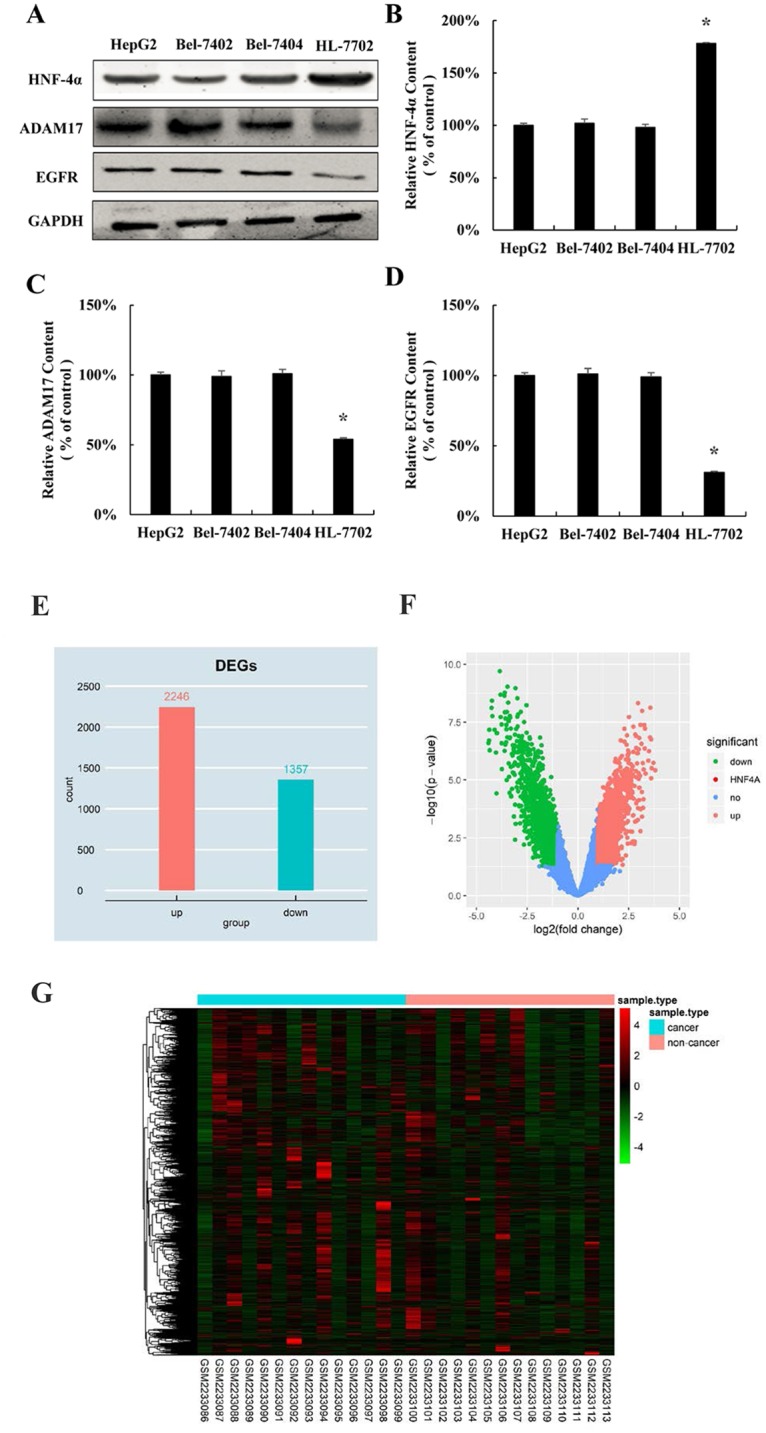
Fig 4. HNF-4α is down-regulated in hepatocellular carcinoma cell lines.

(A) HNF-4α, ADAM17 and EGFR protein expression in normal liver cells (HL 7702, as control group) and three HCC cell lines (HepG2, Bel 7402 and Bel 7404). Relative quantification of HNF-4α (B), ADAM17 (C), and EGFR (D) levels expressed relative to control. (*P < 0.05 vs. the control). (E) Histogram plot of the DEGs. DEGs were selected with P < 0.05 and fold change > 2. (F) Volcano plot of the DEGs. DEGs were selected with P < 0.05 and fold change > 2. (G) DEGs can be effectively divided into hepatocellular carcinoma tissues and adjacent non-cancerous tissues groups. Up-regulated and down-regulated genes were represented by red and green, respectively.
