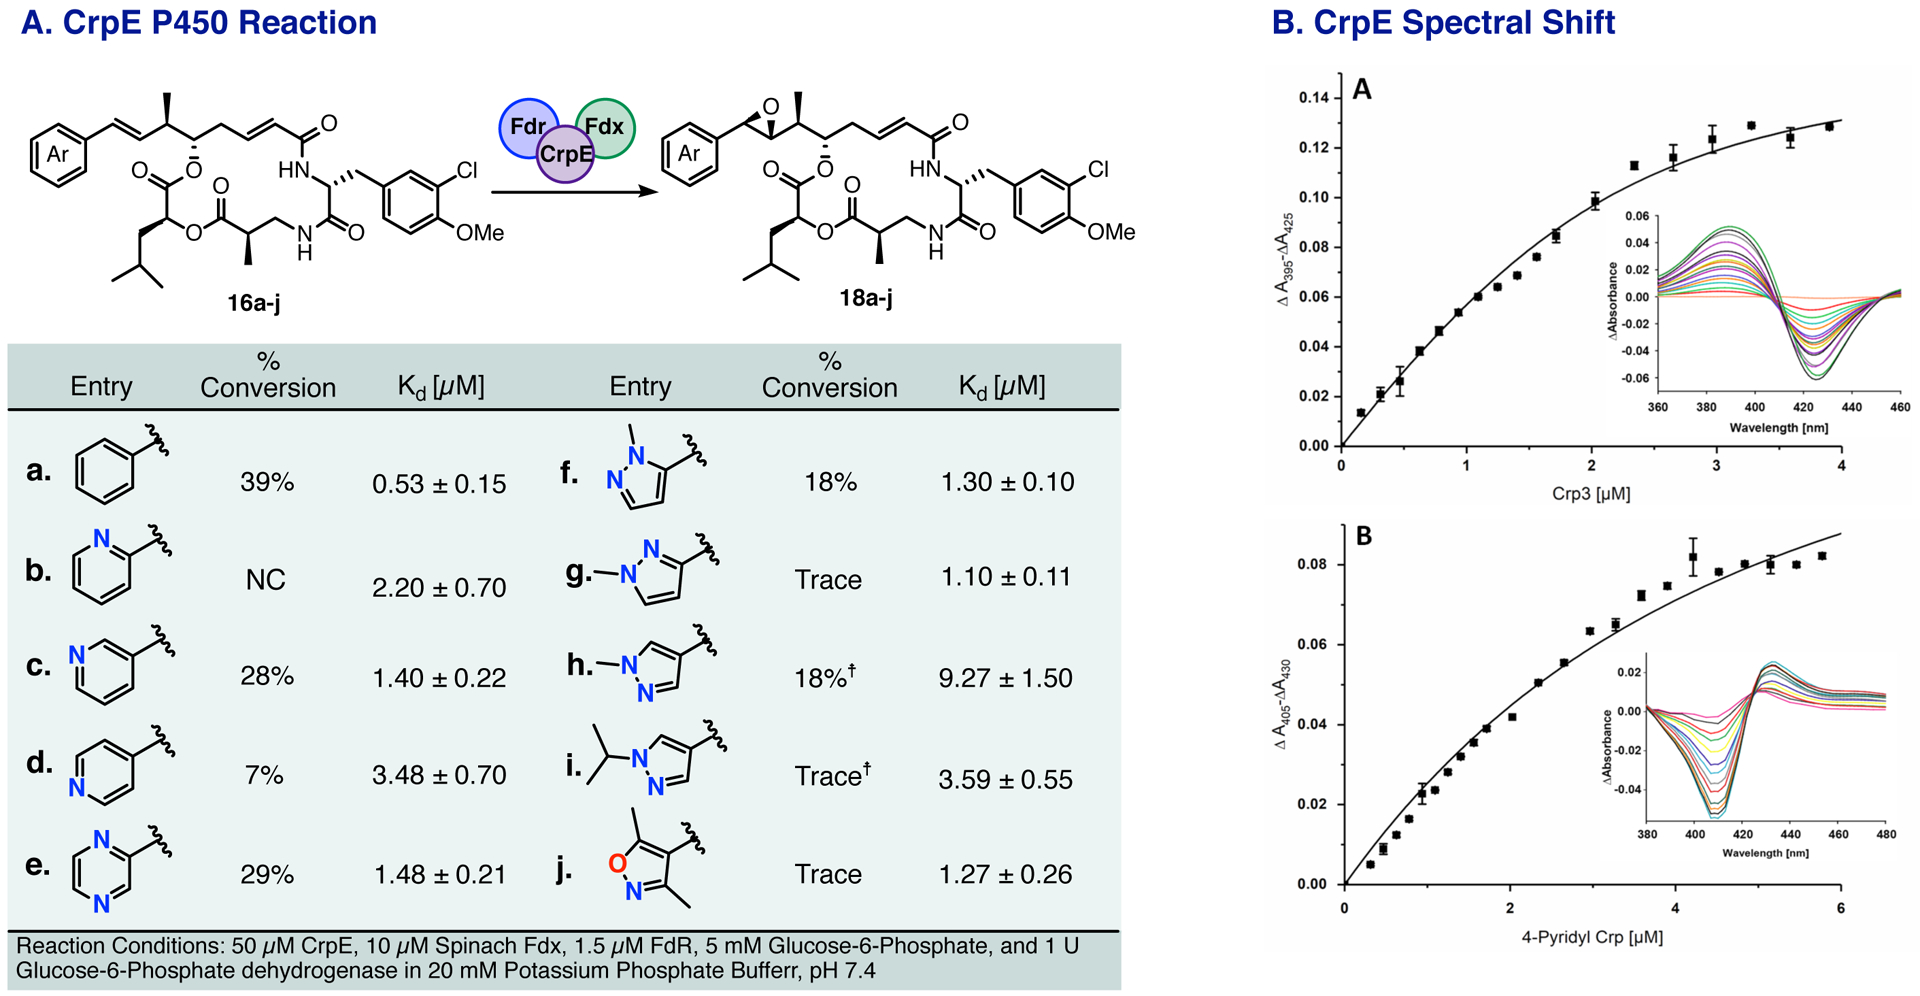
Figure 3.

A. CrpE epoxidation reaction with percent conversion and Kd values for CrpE epoxidation depicted, ☨ indicates [Mepoxidation+H2O] B. Spectral shifts induced by binding of A) Crp3 and B) 4-pyridyl Crp to the P450 CrpE. CrpE displays a type I shift with a peak maximum at 395 nm and a minimum at 425 nm (A), whereas for 4-pyridyl Crp the peak maximum and minimum were 430 and 405, respectively, representing the type II shift.
