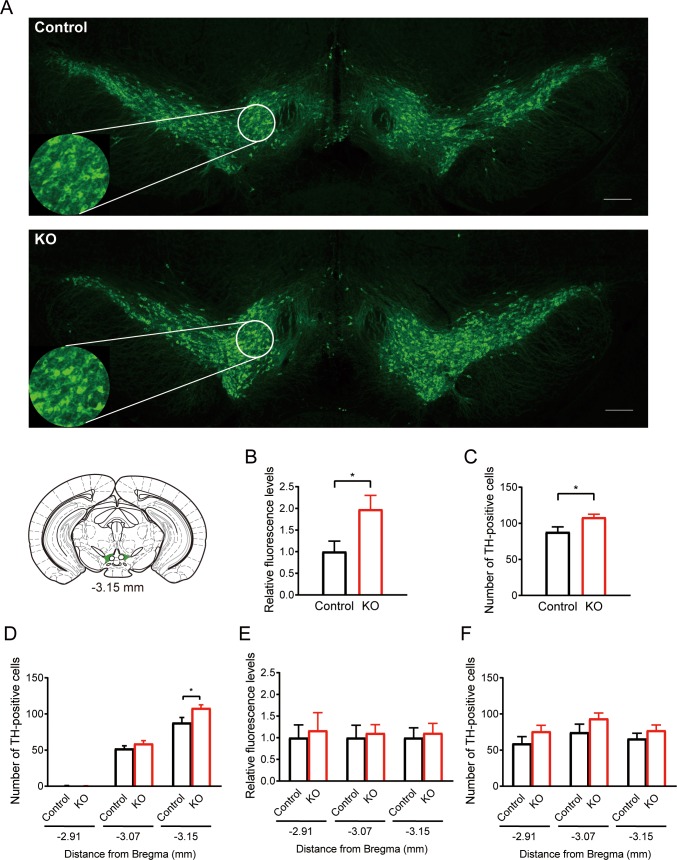
Fig 3. Effects of the KO diet on TH-positive cells in the midbrain.
(A) Immunofluorescent staining of tyrosine hydroxylase (TH) in the ventral tegmental area (VTA) in the coronal sections at bregma -3.15 mm from mice fed the control diet (upper panel) and mice fed the KO diet (lower panel). The scale bars represent 200 μm. The circular panels indicate the area in which TH-positive cells were counted. (B, C) Comparison of the relative fluorescent levels (B) and the number of TH-positive cells (C) between the control and KO diet group at bregma -3.15 mm in the VTA. (D) Comparison of the number of TH-positive cells at different bregma levels in the VTA. The data at bregma -3.15 mm were copied from (C). (E, F) Comparison of relative fluorescent levels (E) and the number of TH-positive cells (F) at different bregma levels in the dorsal of the substantia nigra pars compacta (SNCD) between the control and the KO diet group. Data are obtained from two slices each from five mice. All data are presented as mean and SEM. *: p < 0.05.

