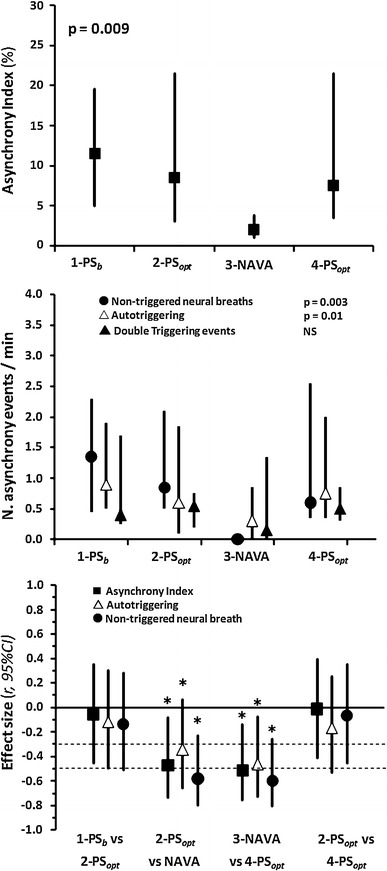
Fig. 2.

Major asynchrony events. 1-PS b Baseline pressure support (PS) with ventilator settings determined by the attending physician, 2-PS opt pressure support after optimization, 3-NAVA level set so that maximum airway pressure equaled maximum airway pressure during 1-PSb and 2-PSopt, 4-PS opt same pressure support settings as in 2-PSopt. N number of asynchrony events per minute. Values in the two upper figures are presented as the median with 25–75 % interquartile range (IQR). Values in the effect size figure are given as Pearson’s correlation coefficient, r, with the 95 % confident interval (CI). Horizontal dotted lines depict the limits for small, mild and large effect size, respectively.*p < 0.0125
