
Fig. 3.
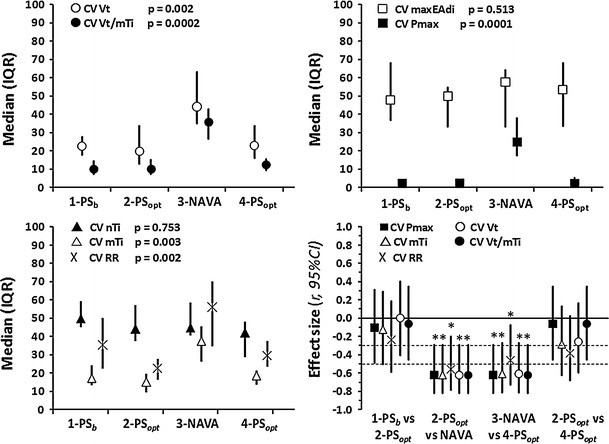
Breath-to-breath breathing variability. CV Coefficient of variation, P max maximum airway pressure per breath, b baseline, opt optimized, RR respiratory rate, V t tidal volume, V t/mTi mean inspiratory flow; for other abbreviations, see Figs. 1 and 2. Values are presented as the median with 25–75 % IQR, except for the effect size figure (bottom right corner) where values are given as Pearson’s correlation coefficient, r, with the 95 % CI; horizontal dotted lines depict the limits for small, mild and large effect size, respectively. *p < 0.0125