
Fig. 4.
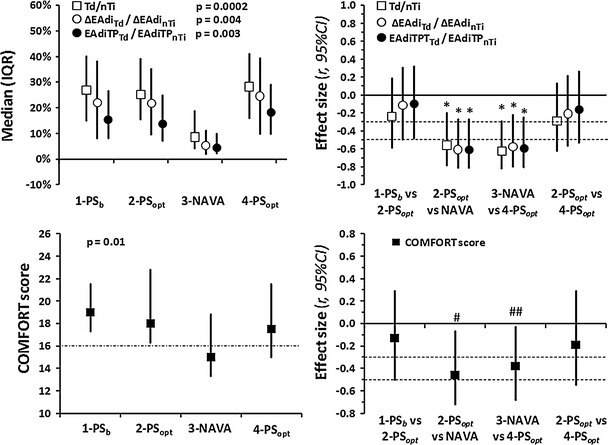
Neural drive to triggering and COMFORT score. ΔEAdi Td/ΔEAdi nTi EAdi change during the triggering delay as a percentage of maximum inspiratory EAdi difference, EAdiTP Td/EAdiTP nTi EAdi–time-product during the triggering delay as a percentage of the EAdi–time-product during neural inspiratory time, Td/nTi triggering delay as a percentage of neural inspiratory time (see Fig. 1). Values in two left figures are given as the median with 25–75 % IQR. COMFORT score dash–dotted line delimits light (above) from deep (below) sedation level. Values in the two right figures are given as Pearson’s correlation coefficient, r, with 95 % CI; horizontal dotted lines depict the limits for small, mild and large effect size, respectively.*p < 0.0125. # p = 0.0125. ## p = 0.050