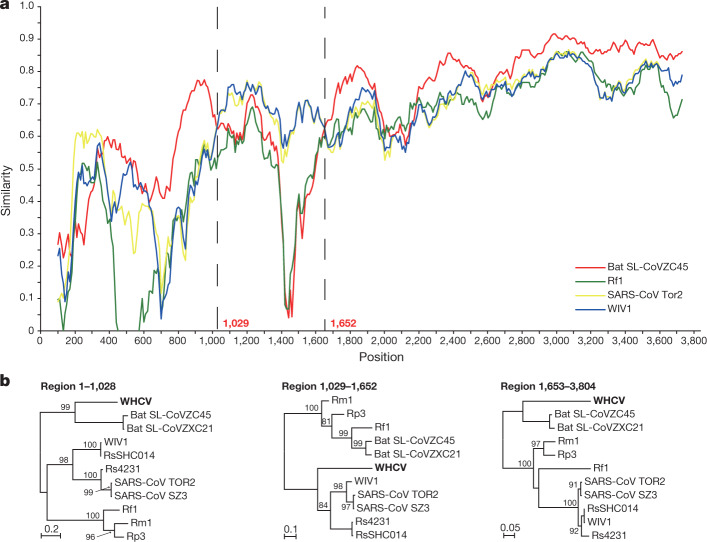
Fig. 3. Possible recombination events in the S gene of sarbecoviruses.
a, The sequence similarity plot reveals two putative recombination breakpoints (black dashed lines), with their locations indicated at the bottom. The plot shows similarity comparisons of the S gene of WHCV (query) compared with the sequences of SARS-CoV Tor2 and bat SARS-like CoVs WIV1, Rf1 and CoVZC45. b, Phylogenies of the major parental region (1–1,028 and 1,653–3,804) and minor parental region (1,029–1,652). Phylogenies were estimated using a maximum likelihood method and were mid-point rooted for clarity only. Numbers above or below the branches indicate percentage bootstrap values. The scale bar represents the number of substitutions per site.

