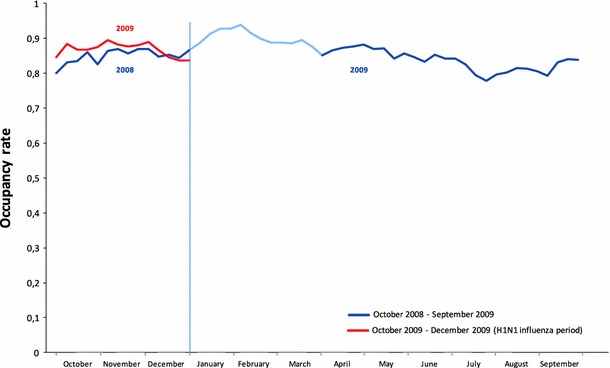
Fig. 2.

ICU occupancy rate over time The light blue line indicates the 2009 seasonal influenza period (January–March). The average weekly occupancy rate was obtained by dividing the number of occupied beds each hour by the total number of beds available in the ICUs, and averaging the hourly rates over the week. This provided a very precise estimate that takes account of patients staying just a few hours in the ICU
