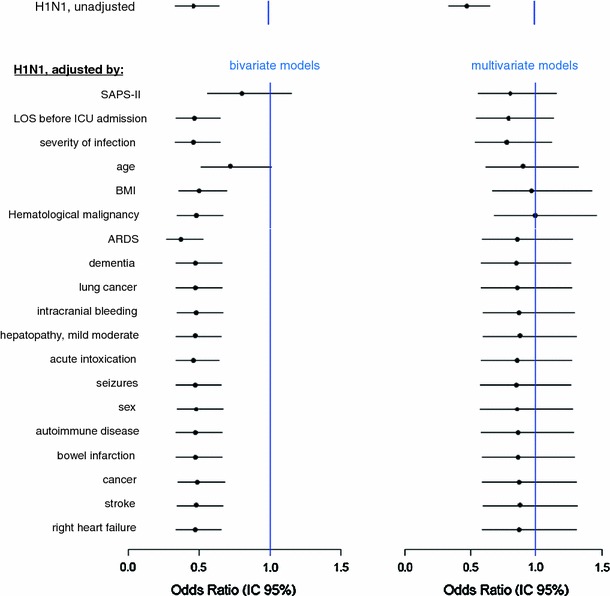
Fig. 4.

OR of hospital mortality due to A(H1N1) pneumonia compared with non-A(H1N1) CAP, from different multivariate models, and OR of H1N1 after different adjustments. In the left-hand column the H1N1 OR is adjusted by the only variable specified in the corresponding row, in a bivariate model. In the right-hand column, the H1N1 OR is adjusted by the variable specified in the corresponding row plus all the variables listed before, in a multivariate model. Hence, for example, the third row of the left column gives the odds ratio of H1N1 after adjustment for severity of infection; the same row on the right gives the odds ratio of H1N1 after adjustment for severity of infection, length of stay (LOS) before ICU admission, and SAPS II. In the full model, the OR of H1N1 was not statistically significant (0.88; 95% CI 0.59–1.31; p = 0.52), as shown in the last row of the right column
