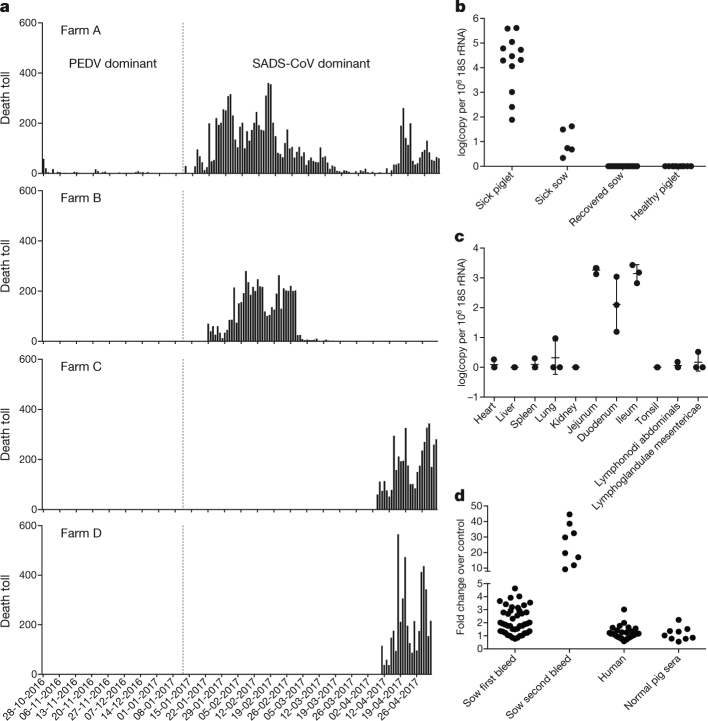
Fig. 1. Detection of SADS-CoV infection in pigs in Guangdong, China.
a, Records of daily death toll on the four farms from 28 October 2016 to 2 May 2017. b, Detection of SADS-CoV by qPCR. The y axis shows the log(copy number per 106 copies of 18S rRNA). n = 12 sick piglets, 5 sick sows, 16 recovered sows and 10 healthy piglets. c, Tissue distribution of SADS-CoV in diseased pigs. n = 3. Data are mean ± s.d.; dots represent individual values. d, Detection of SADS-CoV antibodies. n = 46 sows from whom serum was first taken in the first three weeks of the outbreak (First bleed), n = 8 sows from whom serum was taken again (Second bleed) at more than one month after the onset of the outbreak, n = 8 sera from healthy pig controls, n = 35 human sera from pig farmers.

