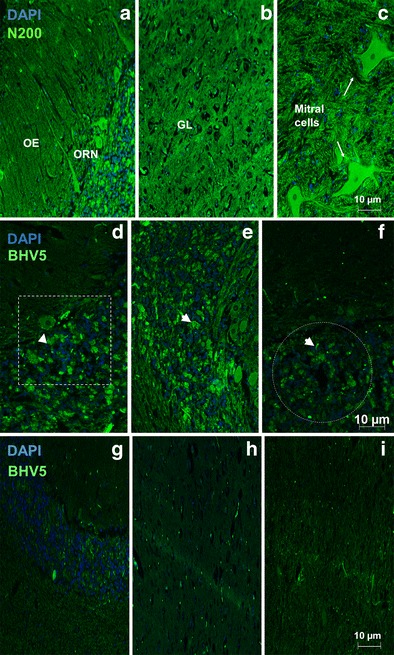
Fig. 2.

Analysis of negative samples showed OBs, divided into a ORNs, b GL, and c ML stained with N200 monoclonal antibody whereas OE-olfactory epithelium, olfactory receptor neurons, and GL-glomerular layer are represented, respectively. The photomicrography is a representative for all negative OBs analyzed. BHV5 antigen visualization by immunofluorescence performed using monoclonal antibody (BHV5 2F9) against BHV 5 (green) followed by DAPI (blue) counterstain. The photomicrography is a representative for all positive 16 OBs, divided into d ORNs, e GL, and f ML analyzed. The arrows indicate positive label for BHV5 and boxed areas represent viral antigens, ×100 magnification. The negative OB samples are illustrated g ORNs, h GL, and i ML, respectively
