
Fig. 3.
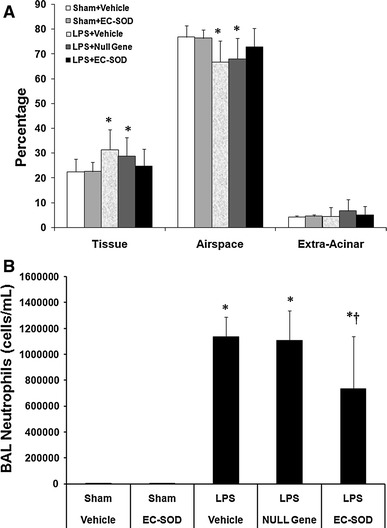
a Histogram representing mean (SD) alveolar tissue and airspace in the lung following endotoxin injury in each group. b Histogram representing mean (SD) bronchoalveolar lavage neutrophil counts from each group. Vehicle, animals that received intratracheal surfactant alone; Null vector, animals that received intratracheal AAV6 encoding no transgene; EC-SOD, animals that received intratracheal AAV6 encoding the EC-SOD transgene. *Significantly different from sham-vehicle group (P < 0.05, ANOVA). †Significantly different from LPS-vehicle and LPS-null groups (P < 0.05, ANOVA)