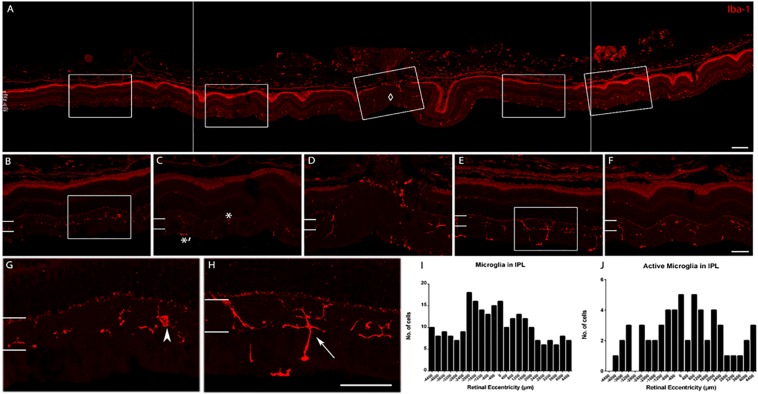
FIGURE 7.
Iba-1 immunolabeling of a retina representative of the young age group. (A) Collage of retinal images spanning ∼2200 μm on either side of the optic nerve head (ONH, marked by ♢). Note the high labeling of Iba-1+ cells in the inner retina and the choroid. (B) Enlarged view of the peripheral retina (∼1952 μm to the left of ONH). (C) Enlarged view of the central retina (∼1120 μm to the left of ONH. Active microglial in IPL is indicated with ∗ and inactive microglia with ∗′ in the NFL. (D) Enlarged view of the ONH area. (E) Enlarged view of the central retina (∼672–1040 μm to the right of ONH). (F) Enlarged view of the peripheral retina (∼1200–1552 μm to the right of ONH). (G) Magnified view of box in (B) (arrowhead: microglia cell in the peripheral retina). (H) Magnified view of box in (E) (arrow: active cell in the central retina). (I) Quantification of microglial cell count in the IPL. (J) Quantification of active microglial cells in the IPL. Scale bar = 80 μm in (A), 40 μm in (B–H).

