
Pairwise distance demarcation of species in the family Coronaviridae.
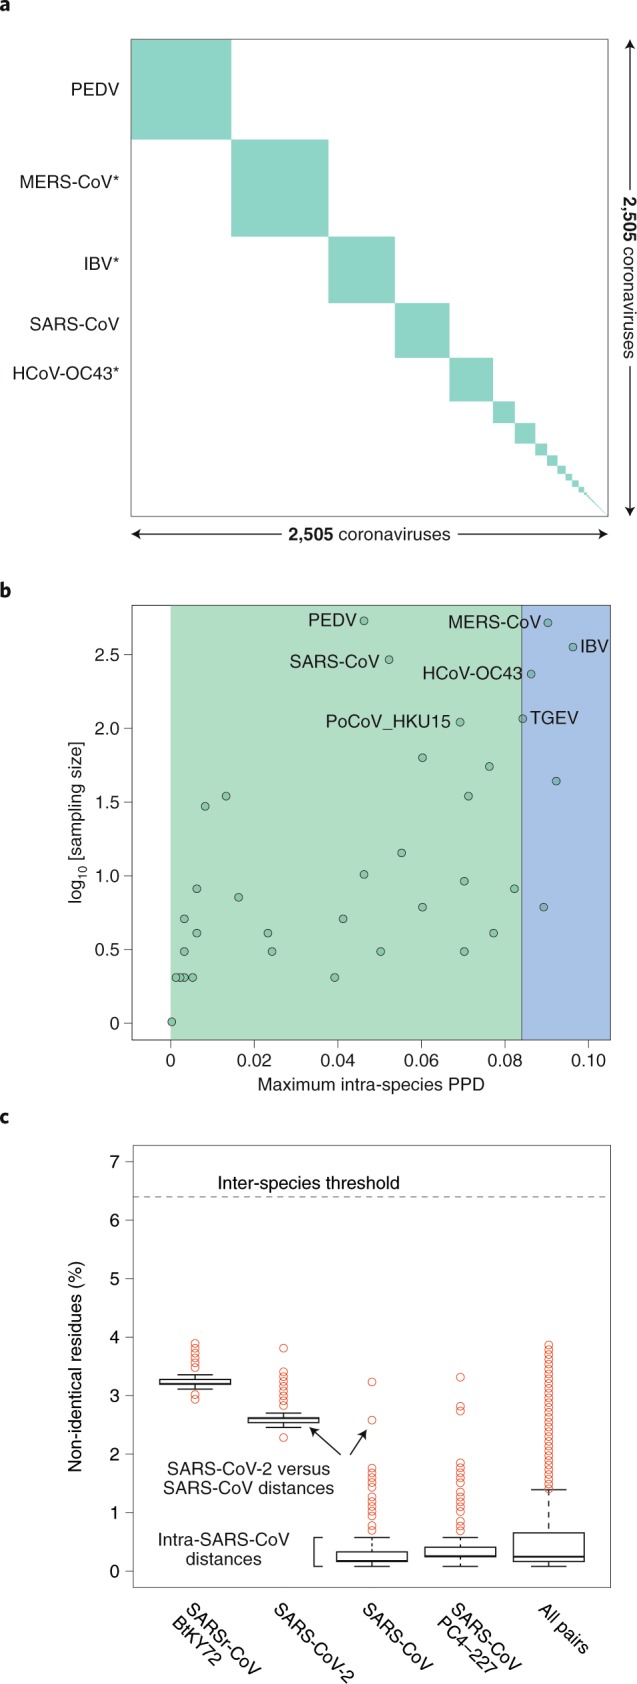
a, Diagonal matrix of PPDs of 2,505 viruses clustered according to 49 coronavirus species, 39 established and 10 pending or tentative, and ordered from the most to least populous species, from left to right; green and white, PPDs smaller and larger than the inter-species threshold, respectively. Areas of the green squares along the diagonal are proportional to the virus sampling of the respective species, and virus prototypes of the five most sampled species are specified to the left; asterisks indicate species that include viruses whose intra-species PPDs crossed the inter-species threshold (threshold ‘violators’). b, Maximal intra-species PPDs (x axis, linear scale) plotted against virus sampling (y axis, log scale) for 49 species (green dots) of the Coronaviridae. Indicated are the acronyms of virus prototypes of the seven most sampled species. Green and blue plot sections represent intra-species and intra-subgenera PPD ranges. The vertical black line indicates the inter-species threshold. c, Shown are the PDs of non-identical residues (y axis) for four viruses representing three major phylogenetic lineages (clades) of the species Severe acute respiratorysyndrome-related coronavirus (panel b) and all pairs of the 256 viruses of this species (‘all pairs’). The PD values were derived from pairwise distances in the MSA that were calculated using an identity matrix. Panels a and b were adopted from the DEmARC v.1.4 output.