
Fig. 1.
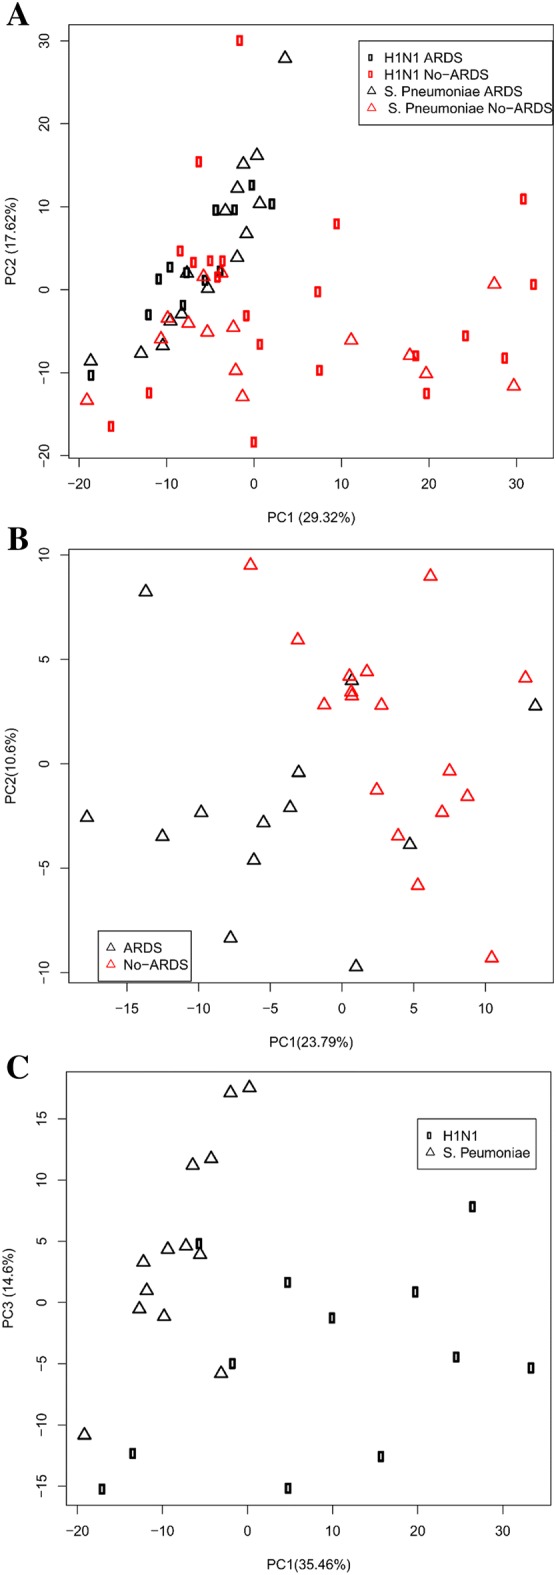
a Score plot of PCA performed on the NMR data of serum samples from patients diagnosed with S. pneumoniae pneumonia (open triangle) and H1N1 influenza virus (open square), with ARDS (black) and without ARDS (red); b score plot of PCA performed on the NMR data of serum samples from patients diagnosed with S. pneumoniae pneumonia with ARDS (black) and without ARDS (red); c score plot of PCA performed on the NMR data of serum samples from patients with ARDS induced by S. pneumoniae (open triangle) or H1N1 influenza virus (open square)