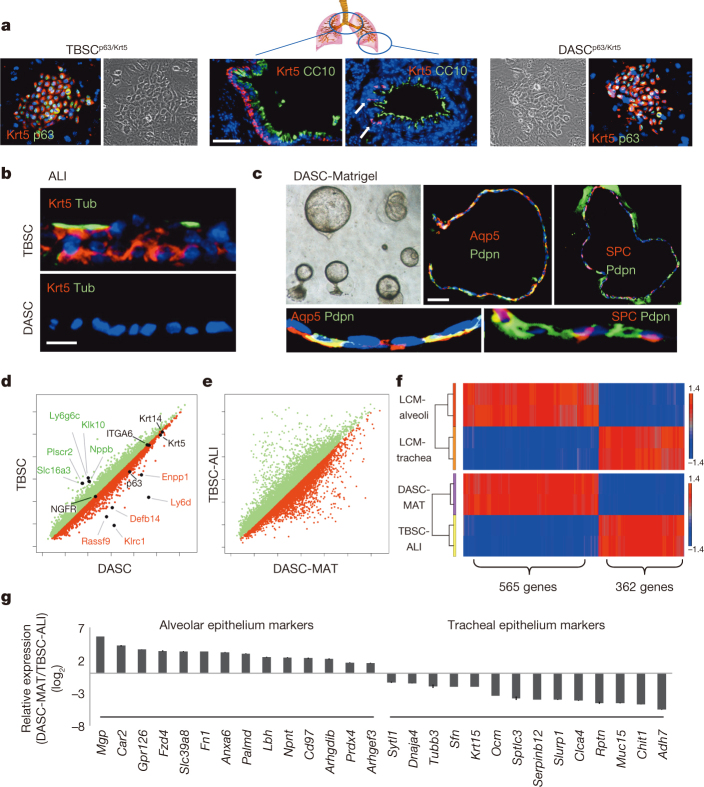
Figure 3. Cloning and in vitro differentiation of DASCs and TBSCs.
a, Krt5+ cells in proximal (left) and distal (arrows, right) lung, with corresponding TBSC and DASC colonies (outside panels). Scale bar, 50 μm. b, Differentiation of TBSC and DASC in air–liquid interface cultures showing respectively stratified epithelia with ciliated (acetylated-Tub+) cells and a monolayer of differentiated cells. Scale bar, 20 μm. c, Unilaminar spheres formed by DASCs in three-dimensional Matrigel cultures and the expression of indicated markers in sections. Scale bar, 50 μm. Insets, high magnification. d, Scatter plot of gene expression of immature TBSCs and DASCs highlighting common and disparately expressed (fold change > 3, P < 0.001) genes. e, Scatter plot of gene expression of TBSC-ALI and DASC-MAT. f, Top, heat map of gene sets differentially expressed in murine alveoli and tracheal epithelium (P < 0.05). Bottom, heat map of differentially expressed genes in DASC-MAT versus TBSC-ALI (P < 0.05) informed by alveolar and tracheal data sets. g, Histogram of differentially expressed genes of DASC-MAT versus TBSC-ALI for which validating immunohistochemistry data are available (see http://www.proteinatlas.org/).

