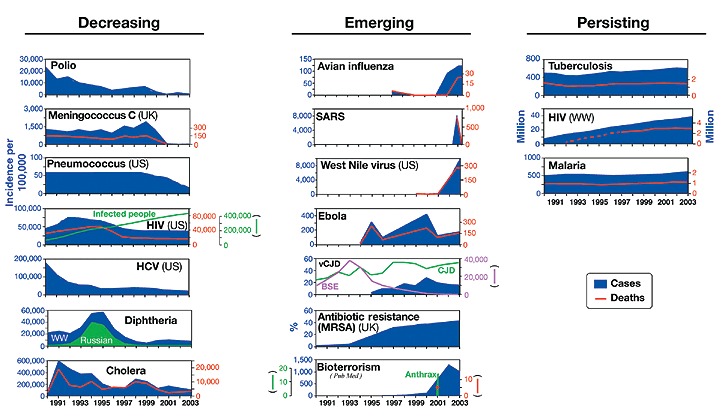
Figure 1. Major changes in infectious diseases during the last decade: the diseases that have been decreasing are shown on the left; the ones that emerged are in the center; those that continued without any change to their trend are shown on the right.

WW represents wordwide. Websites where information for each disease is available are reported in Box 1. In HIV USpanel, new cases per year are shown in blue and total infected population is shown in green. In the bioterrorism panel, publications in PubMed are shown in blue, cases in green and deaths in red.
