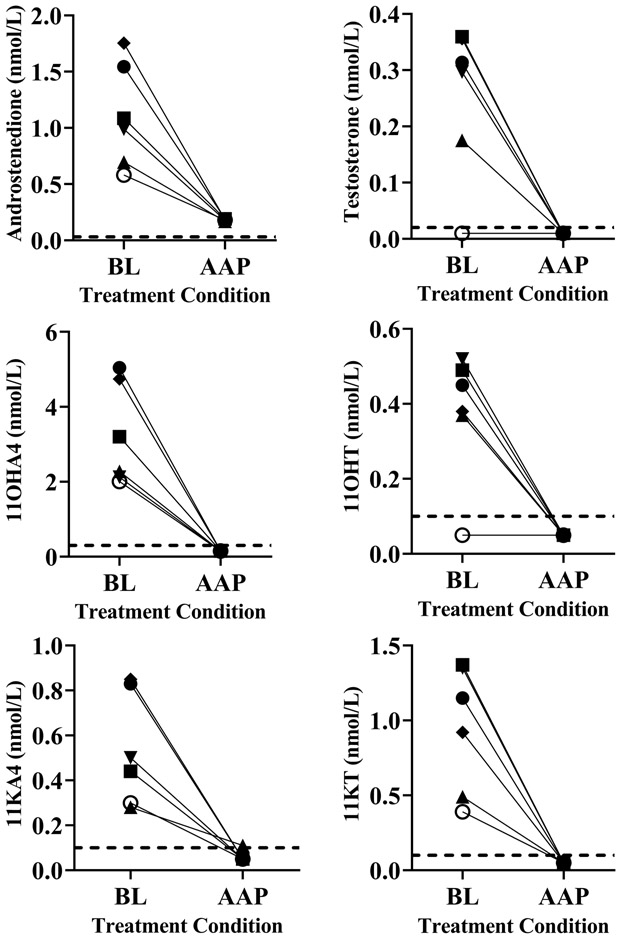
Figure 2.
Reductions in conventional and 11-oxygenated androgens in CRPC patients with AAP treatment. Symbols show individual patient data from baseline (BL) and after at least 4 weeks of AAP therapy. The dotted lines indicate LLOQ for each steroid, and values <LLOQ are plotted midway between 0 and LLOQ. Conversion factors from nmol/L to ng/dL: multiply value by 28.64 for A4, 28.84 for T, 30.24 for 11OHA4 and 11KT, 30.04 for 11KA4, and 30.44 for 11OHT.

