
Figure 1. ARE Activity and HO-1/SRXN1 Transcriptional Profile in WT and Tat-FLAG Cells.
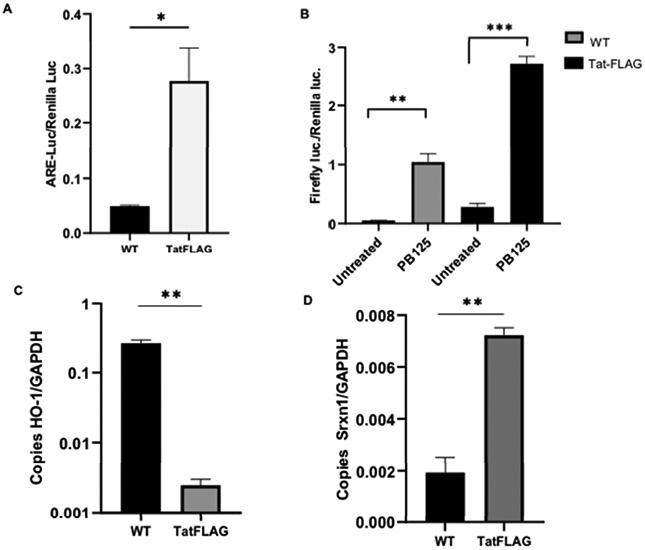
(A)Basal ARE activity is significantly higher in Tat-FLAG cells. Values shown are normalized to renilla luciferase. Mean ± SEM of biological replicates (WT n = 3, Tat-FLAG n = 4)(**p ≤ 0.01 by student’s T-test).
(B)ARE activity is enhanced in PB125 treated WT and Tat-FLAG cells. Cells were left un-treated in culture media or treated with culture media containing 8 mg/L of PB125 for 18 hours. Mean ± SEM of biological replicates (WT n = 3, TatFLAG n = 4) (**p ≤ 0.01, ***p ≤ 0.001 by student’s T-test)
(C) HO-1 Transcription is basally repressed in Tat-FLAG cells compared to WT. (Values shown as absolute copy number. Mean ± SEM of biological replicates (n = 3) (**p ≤ 0.01 by student’s T-test).
(D) SRXN1 Transcription is basally enhanced in Tat-FLAG cells compared to WT. (Values shown as absolute copy number. Mean ± SEM of biological replicates (n = 3) (**p ≤ 0.01 by student’s T-test).