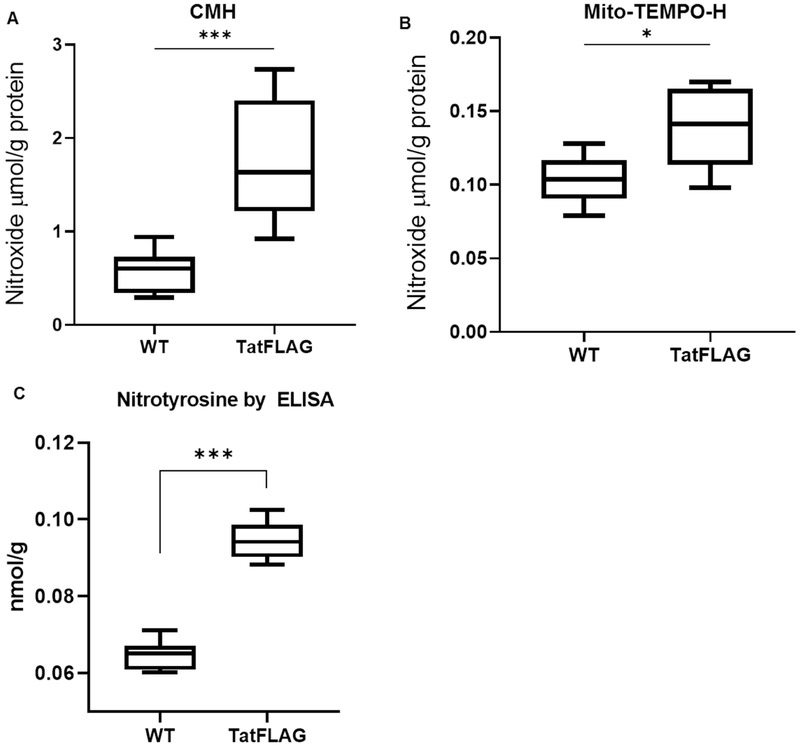
Figure 3. Tat Expressing Cells Exhibit Increased Oxidative Burden and Protein Modification.
.(A) Total ROS is increased in HeLa-Tat-FLAG cells. Total ROS were measured by incubating cells with 1-Hydroxy-3-methoxycarbonyl-2,2,5,5-tetramethylpyrrolidine-HCl (CMH) and nitroxide was measured via EPR spectroscopy. Values shown as nmol of nitroxide per gram of protein.
(WT n = 6, TatFLAG n = 9) (***p ≤ 0.001 by un-paired student’s T-test)
(B) Mitochondrial ROS is increased in HeLa-Tat-FLAG Cells. Mitochondrial ROS were measured by incubating cells with (2-(2,2,6,6-Tetramethylpiperidin-1-oxyl-4-ylamino)-2-oxoethyl)triphenylphosphonium chloride (Mito-TEMPO-H) and nitroxide was measured via EPR spectroscopy. Values shown as nmol of nitroxide per gram protein. (n = 6) (*p ≤ 0.05 by un-paired student’s T-test)
(C) HeLa-Tat-FLAG cells demonstrate increased protein nitrosylation as measured by ELISA. Total 3-nitrotyrosine was measured by ELISA in HeLa-WT and HeLa-Tat-FLAG cells from total protein extract. (n = 6) (**p ≤ 0.01 by unpaired student’s T-test)

