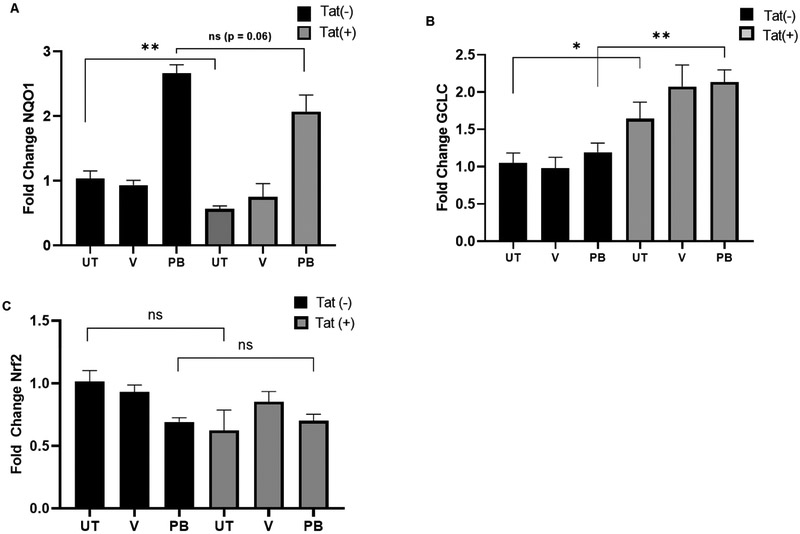
Figure 7. NQO1, GCLC, and Nrf2 Transcript levels in HPAEC.
(A) Tat represses NQO1 basally (B) GCLC transcription is unaffected by PB125 in HPAEC but is enhanced by Tat. (C) Nrf2 transcription is unaffected by PB125 and Tat in HPAEC. Cells were mock transfected or transfected with pTat-FLAG and either left untreated or were treated with vehicle (0.016% ethanol) or PB125 (8 mg/L) for 18 hours. RT-qPCR was performed from total RNA and normalized to GAPDH. Values are shown as fold change relative to Tat(−) un-treated controls. Mean ± SEM of biological replicates (n = 6) (*p ≤ 0.05, **p ≤ 0.01 by un-paired student’s T-test). (UT = Untreated, V = Vehicle, PB = PB125).

