Figure 1.
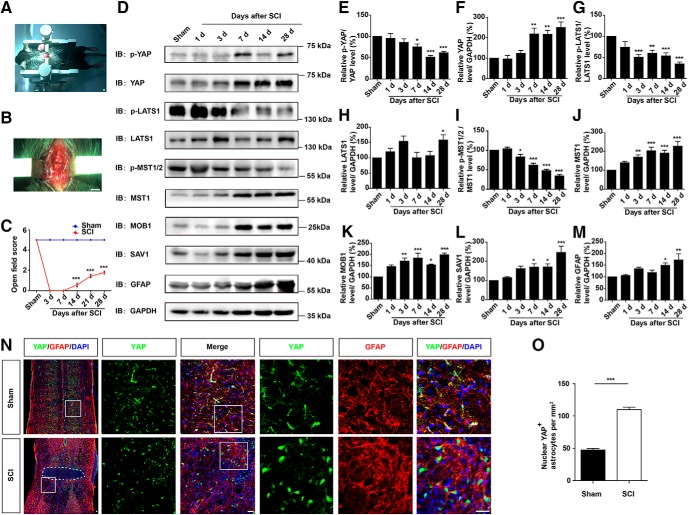
YAP was upregulated and activated in astrocytes after SCI in a Hippo kinase-dependent manner. A–B, Typical images showing the clip-compressive SCI model. C, Quantitative analysis of motor function measured by open field behavioral assays at different stages after SCI (n = 3 per group). D, Western blot analysis of p-YAP, YAP, p-LATS1, LATS1, p-MST1/2, MST1, SAV1, MOB1, and GFAP expression in spinal cords at different stages after SCI. E–M, Quantitative analysis of p-YAP/YAP (E), YAP (F), p-LAST1/LATS1 (G), LATS1 (H), p-MST1/2/MST1 (I), MST1 (J), MOB1 (K), SAV1 (L), and GFAP (M) protein levels as shown in D (n = 4 per group). N, Double immunostaining of YAP (green) and GFAP (red) in spinal cords 14 d after SCI. White dashed lines indicate the injury sites. N, Images of selected regions (white squares) are shown at higher magnification. O, Quantitative analysis of the number of nuclear YAP-positive astrocytes per mm2 as shown in N (n = 4 per group). C, Quantitative data were analyzed using two-way ANOVA with Bonferroni post tests. E–M, Quantitative data were analyzed using one-way ANOVA with Dunnett's multiple-comparison test. O, Quantitative data were analyzed using Student's unpaired two-tailed t test. *p < 0.05, **p < 0.01, ***p < 0.001, compared with control. Data are mean ± SEM. Scale bars: A, B, 200 mm; N, 20 μm.

