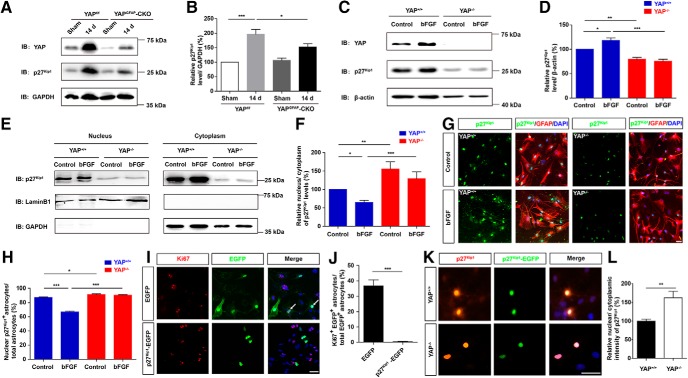
Figure 11.
YAP promoted the proliferation of astrocytes through negatively controlling nuclear distribution of p27Kip1. A, Western blot analysis of YAP and p27Kip1 expression in spinal cords of 2-month-old male yapf/f and yapGFAP-CKO mice 14 d after SCI. B, Quantitative analysis of the relative levels of p27Kip1 as shown in A (n = 4 per group). C, Western blot analysis of total YAP and p27Kip1 expression in yap+/+ and yap−/− astrocytes treated with bFGF treatment (100 ng/ml) for 1 h. D, Quantitative analysis of the relative level of p27Kip1 as shown in C (n = 5 per group). E, Western blot analysis of the nuclear and cytoplasmic expression of p27Kip1 in yap+/+ and yap−/− astrocytes treated with bFGF treatment (100 ng/ml) for 1 h. F, Quantitative analysis of nucleus/cytoplasm ratio of p27Kip1 protein levels as shown in E (n = 8 per group). G, Double immunostaining analysis of GFAP (red) and p27Kip1 (green) in yap+/+ astrocytes and yap−/− astrocytes treated with bFGF treatment (100 ng/ml) for 1 h. H, Quantitative analysis of the percentages of nuclear p27Kip1+ astrocytes over total astrocytes as shown in G (n = 6 per group). I, Immunostaining of Ki67 (red) in astrocytes transfected with EGFP or EGFP-p27kip1 plasmids for 48–72 h after bFGF treatment. J, Quantitative analysis of the percentages of Ki67+/EGFP+ cells over EGFP+ cells as shown in I. K, Immunostaining of p27Kip1 (red) in yap+/+ and yap−/− astrocytes transfected with EGFP-p27kip1 plasmids for 48–72 h. L, Quantitative analysis of the nuclear and cytoplasmic intensity of p27Kip1 in EGFP-p27kip1 astrocytes between yap+/+ and yap−/− astrocytes as shown in K (n = 7 per group). White arrows indicate Ki67 and EGFP positive cells. B, D, F, H, Quantitative data were analyzed using one-way ANOVA with Bonferroni's multiple-comparison test. J, L, Quantitative data were analyzed using Student's unpaired two-tailed t test. Data are mean ± SEM. *p < 0.05, **p < 0.01, ***p < 0.001. Scale bars, 20 μm.

