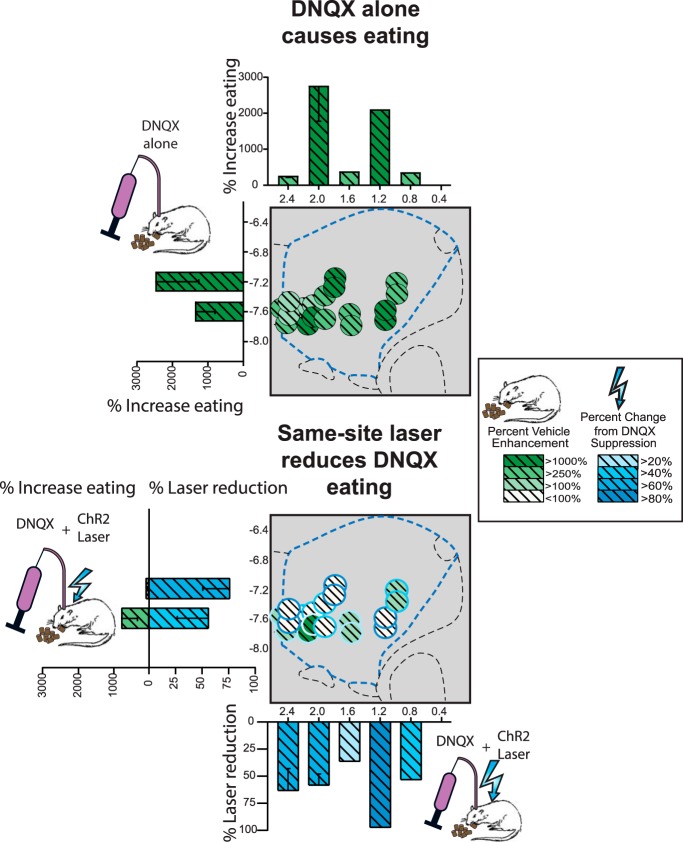
Figure 4.
NAc site maps of intake increases induced by DNQX microinjections and reversals induced by adding laser. Top, Sagittal placements show percentage changes in food intake change from vehicle baseline induced by DNQX microinjections alone (green) in standard laboratory conditions for within-subjects Group 1. Bottom, Percentage suppressions of intake from DNQX levels induced by adding aligned laser illumination (blue).

