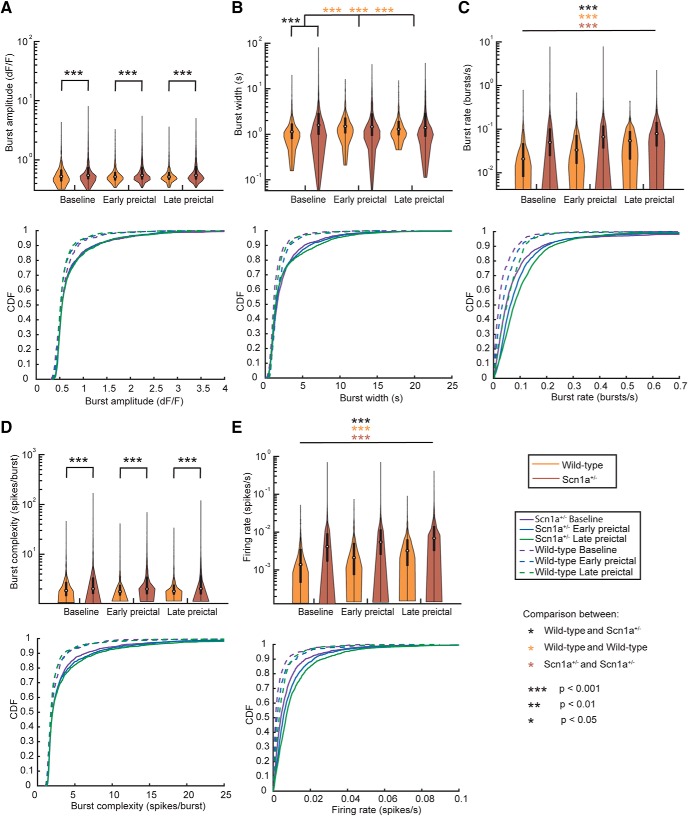
Figure 6.
Neuronal firing properties. Burst amplitude (A), burst width (B), burst rate (C), burst complexity (D), and de-convolved firing rate (E) for wild-type and Scn1a+/− mice during baseline, early, and late preictal periods. Top, Violin plots express the shape of the distribution, white circles indicate the median, and black lines represent the 25–75% quartiles. Bottom, Corresponding cumulative distribution function (CDF) for the above data. Statistical tests were performed using a Wilcoxson rank sum test and Bonferroni corrected for multiple comparisons. For C and E, all pairwise comparisons were statistically significant after multiple comparison correction.

