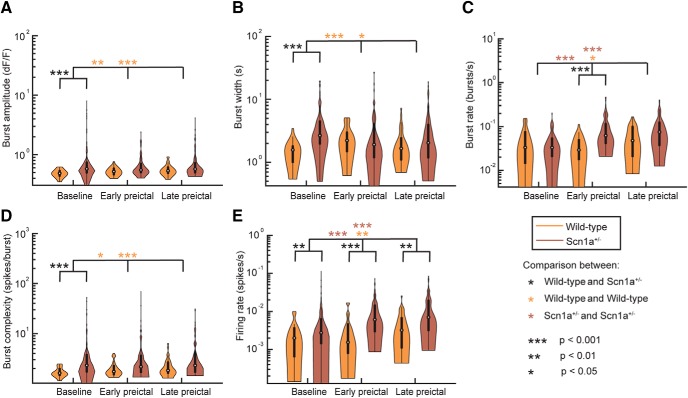
Figure 7.
PV-IN activity profiles. Burst amplitude (A), burst width (B), burst rate (C), burst complexity (D), and de-convolved firing rate (E) for PV-INs in wild-type and Scn1a+/− mice during baseline, early, and late preictal periods. Violin plots express the shape of the distribution, white circles indicate the median, and black lines represent the 25–75% quartiles. Statistical tests were performed using a Wilcoxson rank sum test and Bonferroni corrected for multiple comparisons.

