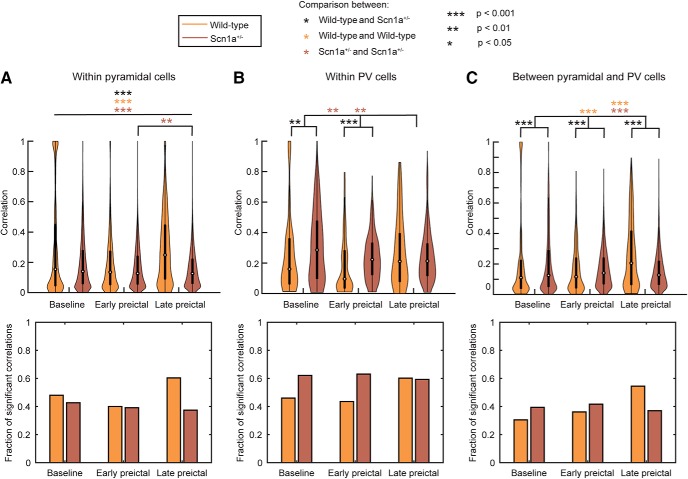
Figure 8.
Neuron synchronization. Synchronization (top) and the fraction of significantly correlated pairs of neurons (bottom) was assessed using the maximum of the absolute value of cross-correlation over a 500 ms window between pairwise spike patterns within excitatory cells (A), within PV-INs (B), and between excitatory cells and PV-INs (C). Violin plots express the shape of the distribution, white circles indicate the median, and black lines represent the 25–75% quartiles. Statistical tests comparing synchronization distributions were performed using a Wilcoxson rank sum test and Bonferroni corrected for multiple comparisons. A, All comparisons are significant at p < 0.001 with the exception of between early and late preictal periods in Scn1a+/− mice, which is significant at p < 0.01. The fraction of significant pairs of synchronized neurons was computed by comparison to surrogate datasets at the 95% level.

