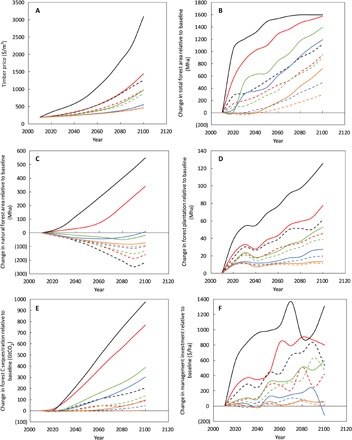
Fig. 3. Global impacts for alternative wood-based bioenergy policies, 2010–2100.

(A) Timber price and changes in (B) total forest area, (C) natural forest area, (D) forest plantation area, (E) total forest carbon stock, and (F) management investment relative to the baseline (no bioenergy demand). Dashed, carbon penalty; solid, forest carbon rental; black, RCP 1.9; red, RCP 2.6; green, RCP 3.4; blue, RCP 4.5; orange, RCP 6.0.
