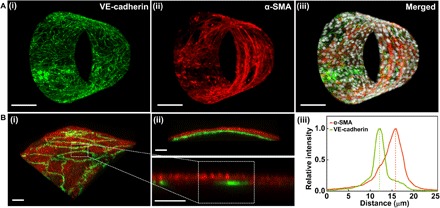
Fig. 4. HPMEC and HPASMC are layered in biomimetic hSMPA.

(A) Reconstructions of confocal Z-stacks of biomimetic hSMPA populated by layered cocultures of HPMEC (luminal) and HPASMC. (i) VE-cadherin (antibody labeling, green), (ii) smooth muscle α-actin (α-SMA) (antibody labeling, red), and (iii) merged image including nuclei from both cell types (DAPI, gray scale). Scale bars, 100 μm. (B) (i) 3D view of two-channel confocal imaging of a small region of a biomimetic hSMPA. HPMEC are visualized using anti–VE-cadherin antibody (green), while smooth muscle α-actin antibody labeling (red) shows the HPASMC. (ii) XZ projection demonstrates segregation and layering of these two cellular components in this biomimetic hSMPA. The bottom panel in (ii) is sampled from (i) and exhibits intensity distribution. Scale bars, 20 μm. (iii) Normalized fluorescence intensity is plotted versus relative radial distance from the tube’s lumen. The distance between the two cell layers is approximately 3.5 μm. A green-magenta rendering of this figure is shown in fig. S7.
