
Fig. 2. RT-MPs induce tumor cell death by causing ferroptosis.
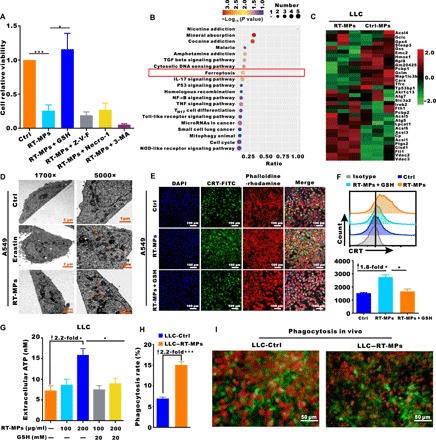
(A) Modulatory profiling of known small-molecule cell death inhibitors in A549 cells treated with RT-MPs (100 μg/ml, 48 hours). (B) KEGG bubble map of differentially enriched proteins. The x axis indicates the ratio of the number of differential proteins in the corresponding pathway to the number of total proteins identified. The colors of the points represent the P values of the hypergeometric test. The sizes of the dots represent the numbers of differential proteins in the corresponding pathway. (C) Heat map of differentially expressed proteins in the ferroptosis pathways of RT-MP–treated and untreated cells. (D) TEM images of A549 cells treated with phosphate-buffered saline (PBS) (24 hours), erastin (2 μM, 24 hours), and RT-MPs (100 μg/ml, 24 hours). Single orange arrowheads indicate shrunken mitochondria. At least 10 cells were examined in each treatment condition. (E) Immunofluorescence staining of calreticulin (CRT) expression (green) on the surface of A549 cells after various treatments. Phalloidine-rhodamine (red) represents the cytoskeleton. Scale bars, 100 μm. (F) Flow cytometric analysis of CRT expression. (G) ATP levels in LLC cells treated as shown with the indicated compounds. (H) BMDMs from C57BL/6 mice showed a higher rate of phagocytosis for RT-MP–treated LLC cells. BMDMs were stained with antibodies to F4/80, and LLC cells were stained with red fluorescence dye PKH26. Flow cytometric analysis was performed to evaluate the rate of phagocytosis. (I) In vivo visualization of phagocytosis of RT-MP–treated cells. LLC-RFP cells were subcutaneously injected (2 × 10⁴) into the window. Macrophages were recruited and phagocytosed more RT-MP–treated LLC-RFP cells in the CX3CR1+/GFP window chamber. Scale bars, 50 μm. *P < 0.05 and ***P < 0.001.