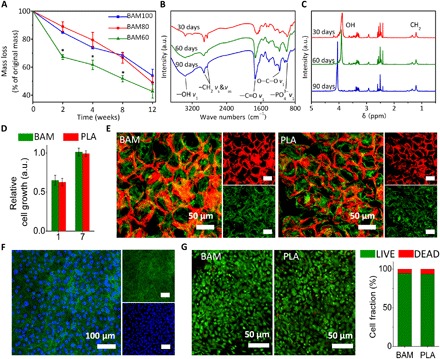
Fig. 2. Morphological and biological characterization of BAM scaffolds.

(A) Degradation profiles for BAM scaffolds in PBS. By controlling the degree of polymerization and density of cross-linking in the polymer network, a zero-order kinetic profile was achieved (within the confines of the experimental conditions), resulting in approximately 50% weight loss at 12 weeks. Values are expressed as means ± SD. *P < 0.05 (significant differences between BAM60 and other tested groups). a.u., arbitrary units. (B) FTIR and (C) 1H NMR spectra confirming the presence of the TCA metabolite succinate in the degradation solution of BAM scaffold. Absorption peaks at around 2950 cm−1 (−CH2) and 1730 cm−1 (−C═O) in FTIR spectra and absorption peaks between 1.2 and 1.5 parts per million (ppm) (CH2) in 1H NMR spectra are attributed to succinate molecules. (D) Relative rat mesenchymal stem cell (rMSC) proliferation on BAM and PLA membrane at days 1 and 7, as determined by CCK-8. (E) F-actin staining of rMSCs on rhodamine B–stained BAM (left) and PLA (right) scaffolds. (F) F-actin staining of rMSCs on BAM membrane. Red, BAM scaffold; green, F-actin (phalloidin); blue, nuclei (4′,6-diamidino-2-phenylindole). (G) LIVE/DEAD staining for rMSCs seeded on BAM (left) and PLA (right) scaffolds and quantified using ImageJ (National Institutes of Health software). Statistical analysis: Unpaired two-tailed Student’s t test. Results in (D) represent the means ± SD of three samples.
